| Indicator | Strategic Direction * | %, RATE OR COUNT |
Status | |
|---|---|---|---|---|
 Access and Treatment |
||||
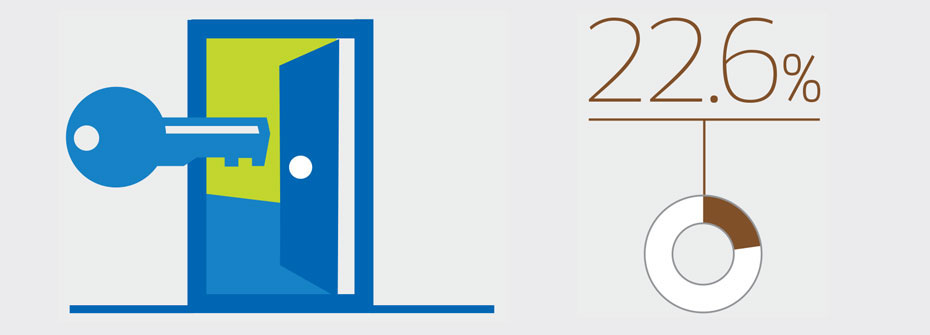
| INDIVIDUALS HOSPITALIZED FOR MORE THAN 30 DAYS IN A YEAR | Access to Services | 22.6 | ||
|
✕
Access and Treatment
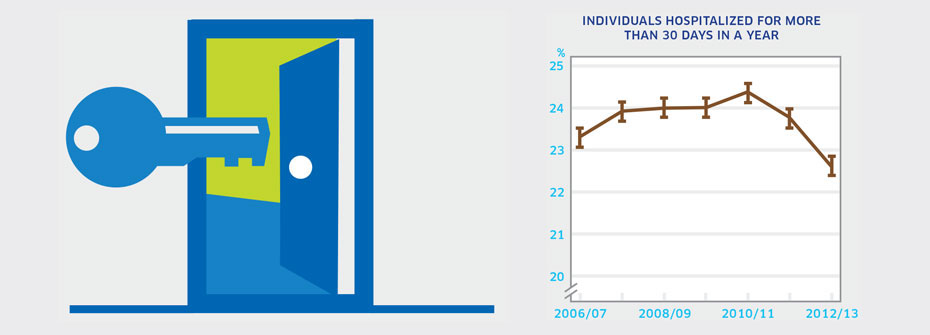
INDIVIDUALS HOSPITALIZED FOR MORE THAN 30 DAYS IN A YEAR
   About
What it tells us
Links to MHCC Activities
What it is:The proportion of individuals hospitalized for a mental illness that spent a total of 30 days or more of the year in hospital in 2012/2013. Source:Canadian Institute for Health Information special tabulation request. Why it's important:Most individuals with a mental illness will not spend time in hospital over the course of a year. However, for those hospitalized, the availability of community care, housing, and good coordination between community and hospital-based services should lead to a high proportion of time spent out of hospital. Consequently, the proportion of patients hospitalized for more than 30 days in a year should be low if adequate community care is available. What it tells usOf those hospitalized with a mental illness diagnosis, 22.6% spent a total of over 30 days in hospital in 2012/13. In the last measurement period, this proportion has dropped from previous years. Due to the relatively high percentage and the drop in the most recent measurement period, the indicator is coded yellow. Limitations:Data are based on hospitalizations for substance-related disorders; schizophrenia, delusional, and non-organic psychotic disorders; mood/affective disorders; anxiety disorders; and selected disorders of adult personality and behaviour. Thus, some uncommon diagnoses may not be included. Data does not include Quebec at this time due to data acquisition delays. 

|
||||
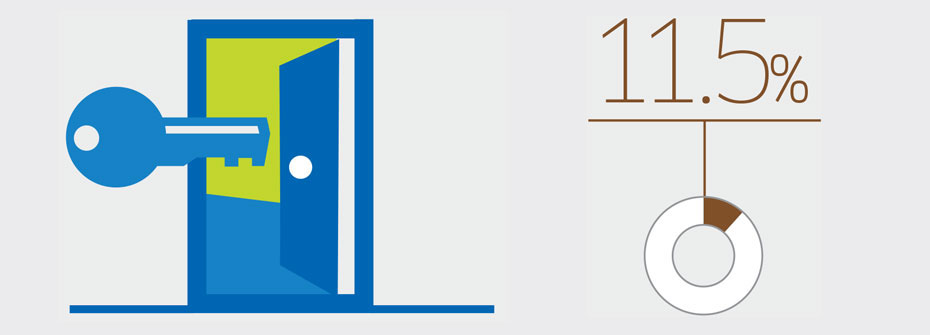
| MENTAL ILLNESS HOSPITAL READMISSIONS WITHIN 30 DAYS | Access to Services | 11.5 | ||
|
✕
Access and Treatment
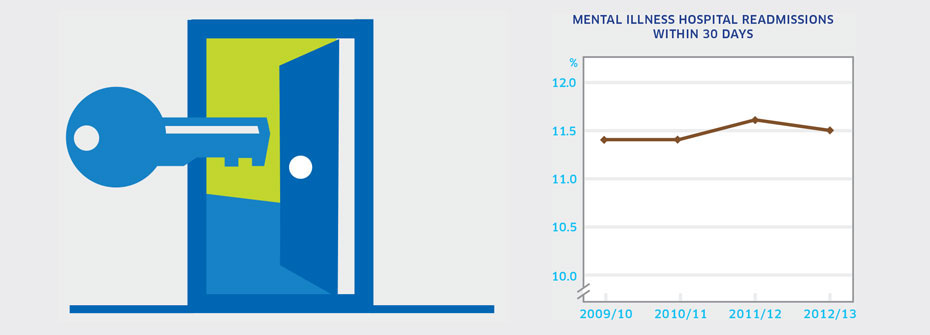
MENTAL ILLNESS HOSPITAL READMISSIONS WITHIN 30 DAYS
   About
What it tells us
Links to MHCC Activities
What it is:The percentage of people aged 15 years or older in 2012/2013 readmitted to hospital within 30 days of hospital discharge for a stay related to a mental illness. Source:Canadian Institute for Health Information Health Indicator portal Why it's important:Often readmission for patients previously hospitalized for a mental illness indicates relapse or complications. However rapid readmission may reflect lack of stabilization during the previous hospitalization, poor discharge planning, or inadequate community support. This indicator is routinely tracked by the Canadian Institute for Health Information as a key measure of system performance. What it tells usJust over 10% of people discharged from hospital after a stay related to a mental illness are readmitted within 30 days. This is a rate that has been consistent over the last four years. The hospital readmission rate for mental illness is similar to that for various physical health conditions. Due to uncertainty regarding the appropriateness of reasons for readmission, this indicator is coded yellow. Limitations:Data are based on hospitalizations for substance-related disorders; schizophrenia, delusional, and non-organic psychotic disorders; mood/affective disorders; anxiety disorders; and selected disorders of adult personality and behaviour. Thus, some uncommon diagnoses may not be included. Excludes patients admitted to free-standing psychiatric facilities.
|
||||
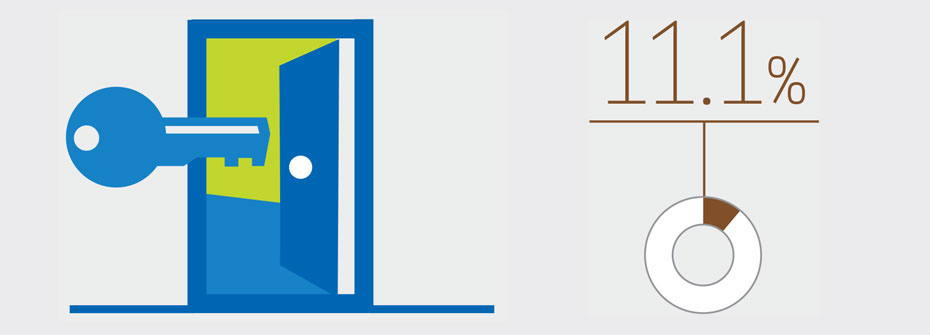
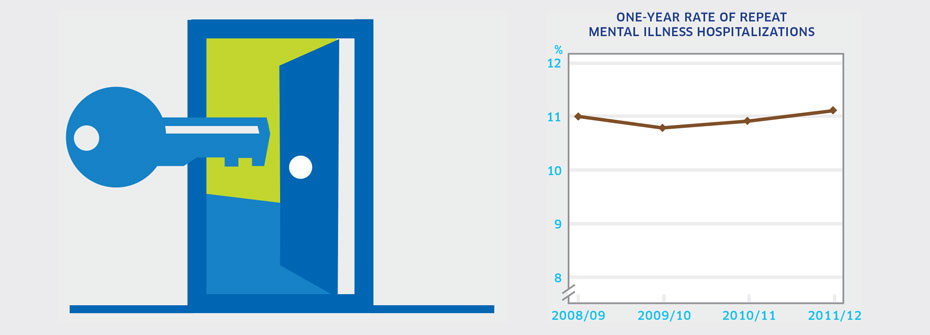
| ONE-YEAR RATE OF REPEAT HOSPITALIZATIONS FOR PERSONS WITH A MENTAL ILLNESS | Access to Services | 11.1 | ||
|
✕
Access and Treatment
ONE-YEAR RATE OF REPEAT HOSPITALIZATIONS FOR PERSONS WITH A MENTAL ILLNESS
   About
What it tells us
Links to MHCC Activities
What it is:The percentage of people aged 15 years or older in 2011/2012 with at least three mental illness-related hospitalizations among those who had at least one hospital stay for a mental illness over a one-year period. Source:Canadian Institute for Health Information Health Indicator portal Why it's important:Multiple hospital admissions in the same year may be warranted in people with serious mental health disorders but may also reflect poor discharge planning or shortcomings in community care. Repeat hospitalizations are routinely tracked by the Canadian Institute for Health Information as a key measure of system performance. What it tells usMore than one in ten individuals hospitalized for a mental illness experience subsequent hospitalizations resulting in three or more hospital stays in the same year. This rate is virtually unchanged since 2008. Hence this indicator is coded yellow. Limitations:Data are based on hospitalizations for substance-related disorders; schizophrenia, delusional, and non-organic psychotic disorders; mood/affective disorders; anxiety disorders; and selected disorders of adult personality and behaviour. Thus, some uncommon diagnoses may not be included. Excludes patients admitted to free-standing psychiatric facilities.
|
||||
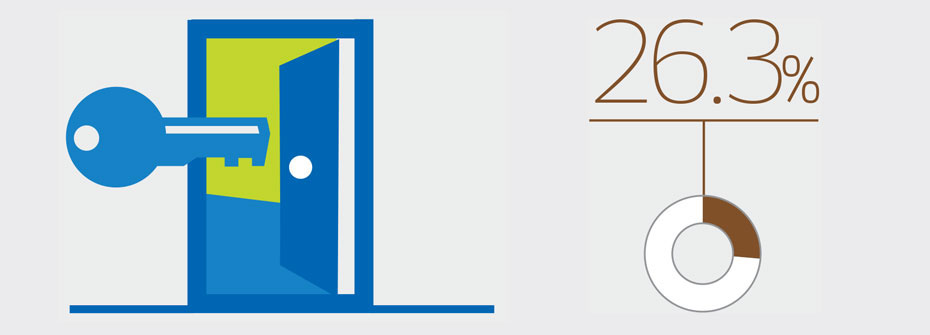
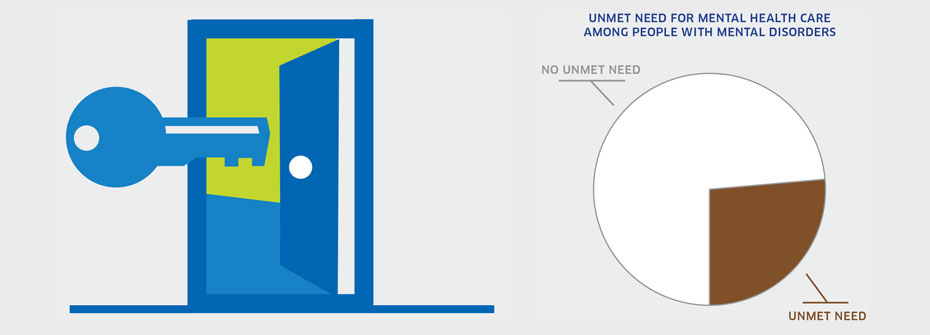
| UNMET NEED FOR MENTAL HEALTH CARE AMONG PEOPLE WITH MENTAL DISORDERS | Access to Services | 26.3 | ||
|
✕
Access and Treatment
UNMET NEED FOR MENTAL HEALTH CARE AMONG PEOPLE WITH MENTAL DISORDERS
   About
What it tells us
Links to MHCC Activities
What it is:The percentage of Canadians aged 15 years or older with mental disorders that reported, in 2012, there was a time they needed mental health care but did not receive care. Source:Canadian Community Health Survey, Mental Health Supplement, Public Use Microdata File, Statistics Canada (2012). Why it's important:Receipt of mental health care when needed can be necessary to support improvement and recovery and to prevent worsening of mental health problems that could lead to increased disability or to other harms. What it tells us26.3% of people who were identified as having mental disorders report that they did not receive care they needed for their emotions, mental health, or use of alcohol or drugs. It is notable that, when asked the reasons why they did not get the help they needed, the most common answer given was that they preferred to manage themselves. This could be due to a true preference to manage and recover without mental health care. However, this preference could be based on fears or concerns about receiving mental health care because of associated stigma. Given the sizeable proportion of people with mental disorders who report unmet need, this indicator is coded red. Limitations:The findings in the national survey are limited to a subset of people with mental disorders (i.e., mood, anxiety, and substance use disorders) and may not reflect levels of unmet need amongst people with other mental disorders.
|
||||
 Adults |
||||
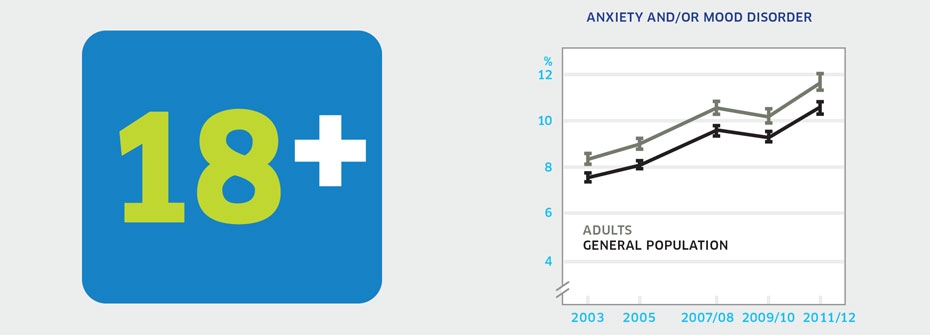
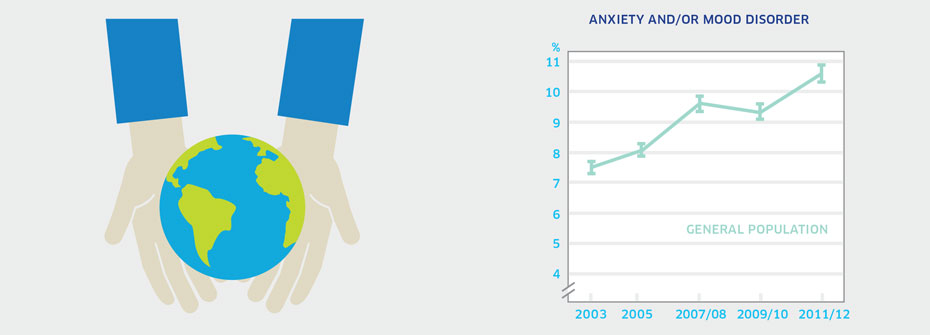
| ANXIETY AND/OR MOOD DISORDERS – ADULTS | Promotion and Prevention | 11.6 | ||
|
✕
Adults
ANXIETY AND/OR MOOD DISORDERS – ADULTS
   About
What it tells us
Links to MHCC Activities
What it is:The percentage of Canadians aged 20 to 64 years that reported in 2011/2012 that they have an anxiety disorder and/or mood disorder which has been diagnosed by a health care professional. Source:Canadian Community Health Survey, Public Use Microdata File, Statistics Canada (years 2003, 2005, 2007/08, 2009/10, 2011/12). Why it's important:Anxiety and mood disorders are the most common mental health conditions in adults and contribute to significant distress and impairment. Improved detection of mood and anxiety disorders could result in improved self-management and treatment outcomes. What it tells usSelf-reports of diagnosed anxiety and/or mood disorders in adults are increasing over time. While it might appear as though these disorders are on the rise, increasing rates may instead reflect better detection and diagnosis by health care professionals, particularly family doctors who would see the large majority of such individuals. Due to this uncertainty, this indicator is coded yellow. Limitations:Self-reports of diagnosed anxiety and mood disorders are based on single survey questions and may not correspond to prevalence rates based on epidemiologic studies. Reported receipt of a diagnosis for an anxiety and/or mood disorder does not necessarily imply receipt of treatment.
|
||||
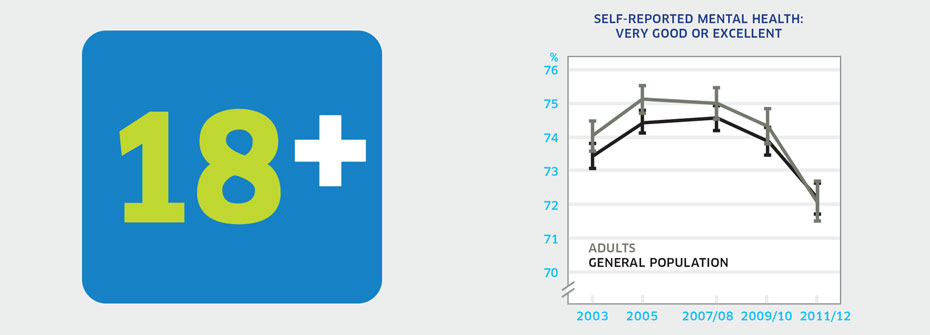
| SELF-RATED MENTAL HEALTH - ADULTS | Promotion and Prevention | 72.1 | ||
|
✕
Adults
SELF-RATED MENTAL HEALTH - ADULTS
   About
What it tells us
Links to MHCC Activities
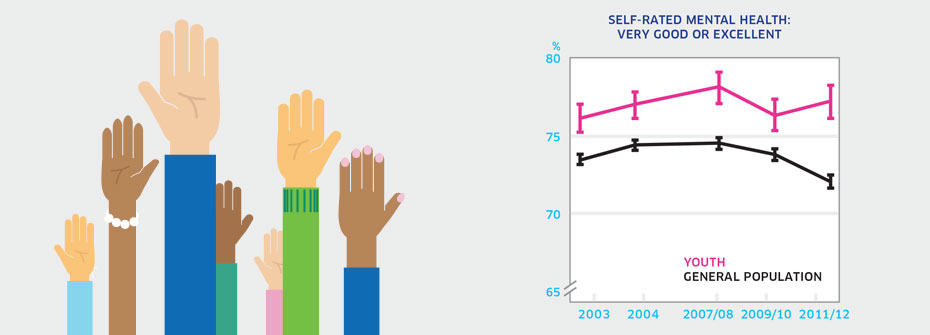
What it is:The percentage of Canadians aged 20 to 64 years that reported their mental health as very good or excellent in 2011/2012. Source:Canadian Community Health Survey, Public Use Microdata File, Statistics Canada (years 2003, 2005, 2007/08, 2009/10, 2011/12). Also available from CANSIM table 105-0501. Why it's important:Examining self-rated mental health for different age groups helps identify patterns of mental wellbeing over the lifespan. Adults face career and family-related issues unique to their stage of life which may affect their mental wellbeing. Adult self-rated mental health can be compared to that of youth and seniors. What it tells usNearly three-quarters of the adult population report very good or excellent mental health. There is a slight increase over time for the percentages reporting *poor* or *fair* mental health. These patterns are very similar to those in the general population, where all age groups are reflected. While most adults enjoy *very good* or *excellent* mental health, the rate is declining over time. Therefore, this indicator is coded yellow. Limitations:When taken as a measure of the entire adult population, lower or higher rates among distinct groups can be masked. High self-rated mental health does not necessarily mean an absence of mental illness.
|
||||
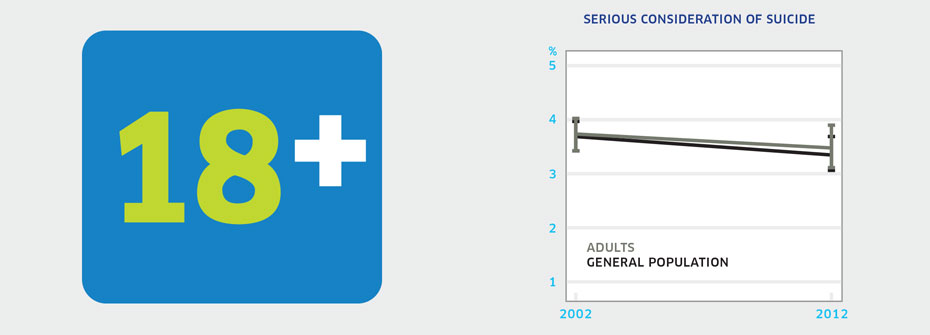
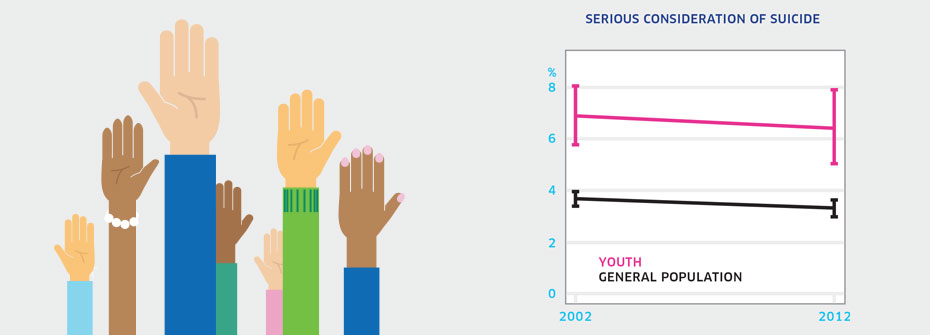
| SERIOUS CONSIDERATION OF SUICIDE - ADULTS | Promotion and Prevention | 3.5 | ||
|
✕
Adults
SERIOUS CONSIDERATION OF SUICIDE - ADULTS
   About
What it tells us
Links to MHCC Activities
What it is:The percentage of Canadians aged 20 to 64 years that reported, in 2012, having seriously thought about suicide or taking their own life in the last 12 months. Source:Canadian Community Health Survey, Mental Health Supplement, Public Use Microdata File, Statistics Canada (years 2002 and 2012). Why it's important:Most adults who express thoughts of suicide will not die by suicide. However serious consideration of suicide may be associated with severe depression and hopelessness and signals a need for formal help. As such, serious suicidal thoughts are an important risk factor in people of all ages. What it tells us3.5% of adults report having serious suicidal thoughts over the past 12 months. This rate has not changed over the last decade. Due to the lack of change over the 10-year period, this indicator is coded yellow. Limitations:In 2002, data collection issues meant that some results had to be imputed.
|
||||
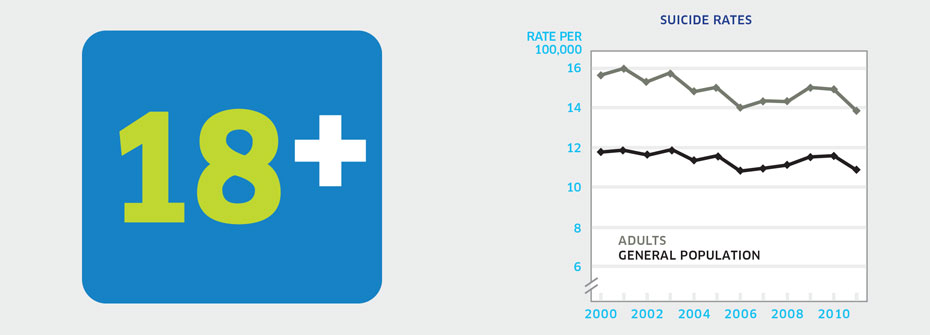
| SUICIDE RATES - ADULTS | Promotion and Prevention | 13.8 PER 100,000 | ||
|
✕
Adults
SUICIDE RATES - ADULTS
   About
What it tells us
Links to MHCC Activities
What it is:The rate of suicide per 100,000 Canadians aged 20 to 64 years in 2011. Source:Statistics Canada CANSIM Table 102-0551. Why it's important:Suicide is a preventable cause of death but rates in Canada remain unacceptably high. An examination of suicide rates over time in relation to demographic, social, and clinical factors can help identify which adults are at higher risk. What it tells usThe suicide rate for adults was 13.8 per 100,000 in 2011. The highest rates were observed among males aged 45-49 and 50-54 (26.6 per 100,000 and 25.7 per 100,000 respectively). Overall rates have declined only slightly since the year 2000 (15.6) with some year-to-year variability over the last decade. Hence, this indicator is coded red. Limitations:Investigations of cause of death can be difficult and consequently the determination of death by suicide may not always be accurate.
|
||||
 Caregiving |
||||
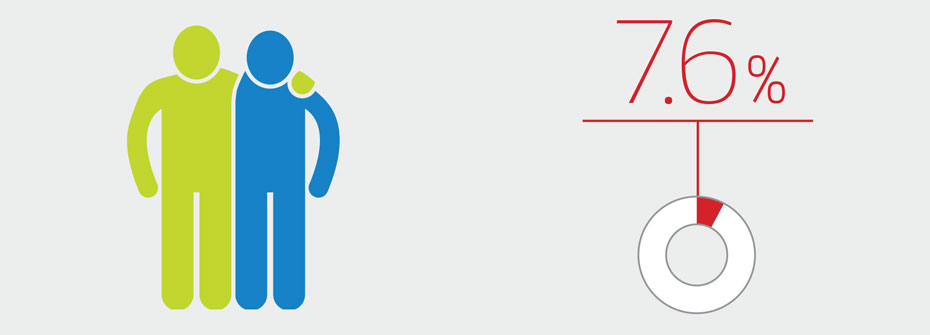
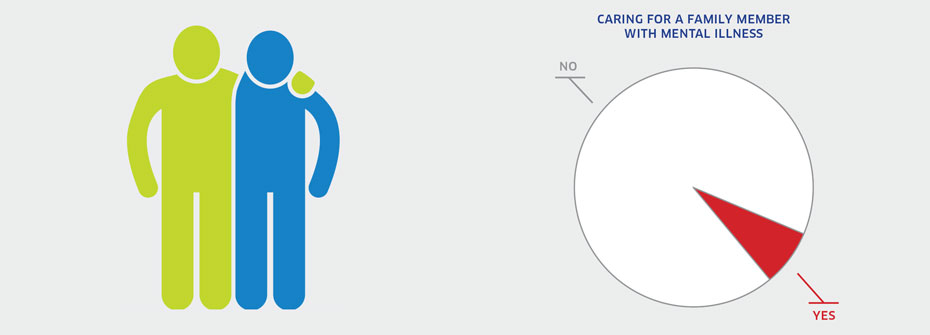
| CARING FOR A FAMILY MEMBER WITH MENTAL ILLNESS | Disparities and Diversity | 7.6 | ||
|
✕
Caregiving
CARING FOR A FAMILY MEMBER WITH MENTAL ILLNESS
   About
What it tells us
Links to MHCC Activities
What it is:The percentage of family caregivers aged 15 years or older that provided care to an immediate family member who has a mental illness in 2012. Source:General Social Survey, Statistics Canada, Cycle 26 (2012). Why it's important:The extent of family caregiving to support individuals with mental illness reflects the degree of disability associated with mental illnesses and their impact on families. Caregivers may experience enduring stress associated with caregiving responsibilities. This stress has been linked to poor outcomes such as depression. What it tells usThere are over 4 million family caregivers in Canada. Among these, 7.6 % or 322,556 individuals provide care to a family member with a mental illness. This large population of caregivers should be monitored and supported and for that reason this indicator is coded yellow. Limitations:In Cycle 26, caring was measured over the past 12 months and may have missed families providing care for individuals with an episodic illness that has been in remission over that year. This result may underestimate the number of caregivers since it requires that the individuals providing care to family member with mental illness define themselves as caregivers.
|
||||
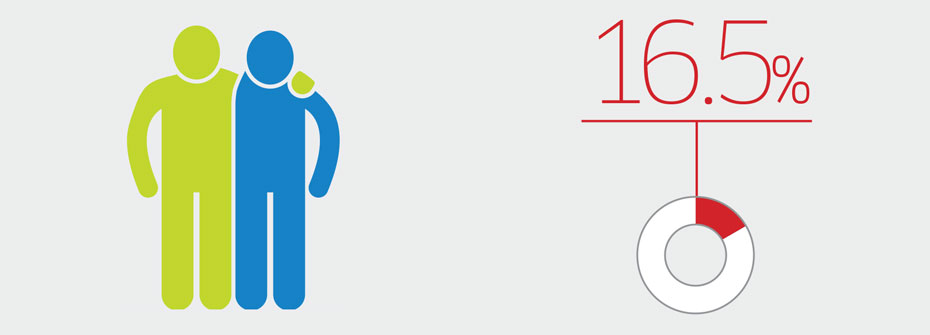
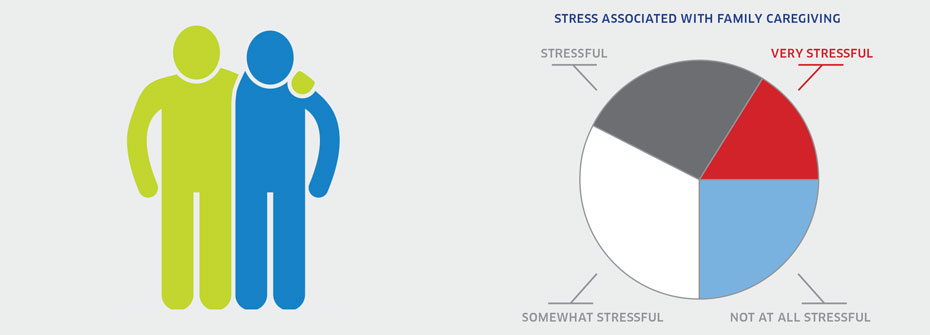
| STRESS ASSOCIATED WITH FAMILY CAREGIVING | Promotion and Prevention | 16.5 | ||
|
✕
Caregiving
STRESS ASSOCIATED WITH FAMILY CAREGIVING
   About
What it tells us
Links to MHCC Activities
What it is:The percentage of Canadians aged 15 years or older that provided care to an immediate family member with a long-term health condition, a physical or mental disability or aging-related problem in the past 12 months and reported in 2012 that their caregiving responsibilities were very stressful. Source:General Social Survey Cycle 26 (2012). Why it's important:Caregivers are an invaluable asset to formal health care and social service systems in supporting individuals with physical and/or mental health conditions. The demands of family caregiving can result in overwhelming stress on a day-to-day and longer-term basis, putting a caregiver’s own health at risk. What it tells usVery high levels of stress are reported by 16.5% of the population in family caregiving roles. Canada’s aging population means higher projected numbers of people with dementia and other chronic illnesses. This may result in an increase in the number of family caregivers and consequently, a rise in those subject to excessive stress. Hence this indicator is coded red. Limitations:Does not include data from Canadian territories.
|
||||
 Children And Youth |
||||
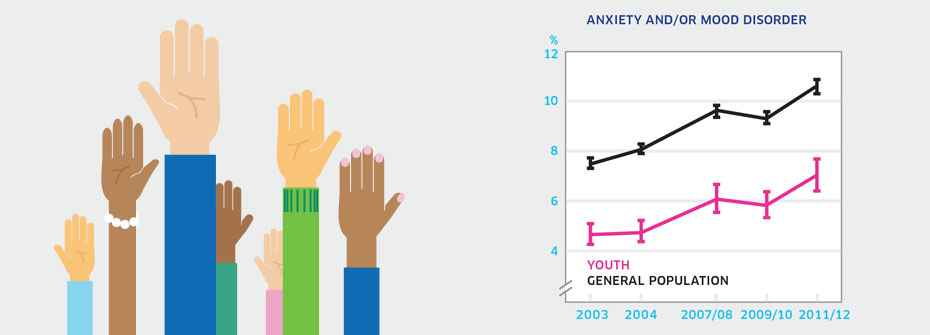
| ANXIETY AND/OR MOOD DISORDERS – YOUTH | Promotion and Prevention | 7.0 | ||
|
✕
Children And Youth
ANXIETY AND/OR MOOD DISORDERS – YOUTH
   About
What it tells us
Links to MHCC Activities
What it is:The percentage of Canadians aged 12 to 19 years that reported in 2011/2012 that they have an anxiety disorder and/or mood disorder which has been diagnosed by a health care professional. Source:Canadian Community Health Survey, Public Use Microdata File, Statistics Canada (years 2003, 2005, 2007/08, 2009/10, 2011/12). Why it's important:Anxiety and mood disorders are among the most common mental health conditions in children and youth and can negatively affect social and academic functioning. Early identification and treatment can prevent the development of more severe problems and improve long-term outcomes. What it tells usA larger percentage of youth are reporting that they have received a diagnosis of an anxiety disorder and/or mood disorder in 2011/2012 than was the case in previous years. The rate of 7.0% in the most recent survey was higher than rates in 2003 (4.6%) and 2005 (4.7%). While it might appear as though these disorders are on the rise among youth, increasing rates may instead reflect better detection and diagnosis by health care professionals, particularly family doctors who would see the large majority of such individuals. Due to this uncertainty, this indicator is coded yellow. Limitations:Self-reports of diagnosed anxiety and mood disorders are based on single survey questions and may not correspond to prevalence rates based on epidemiologic studies. Reported receipt of a diagnosis for an anxiety and/or mood disorder does not necessarily imply receipt of treatment.
|
||||
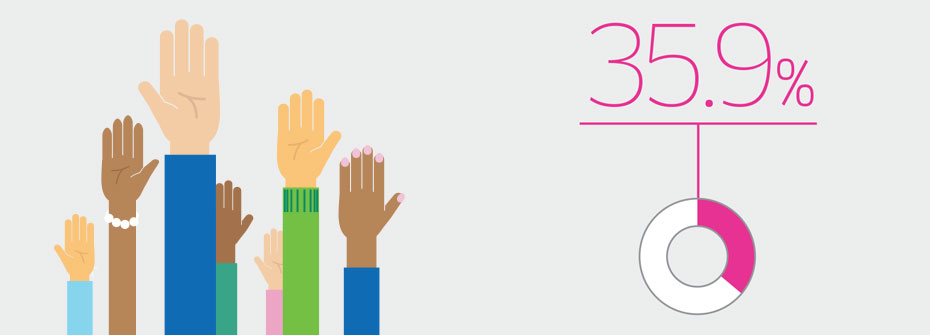
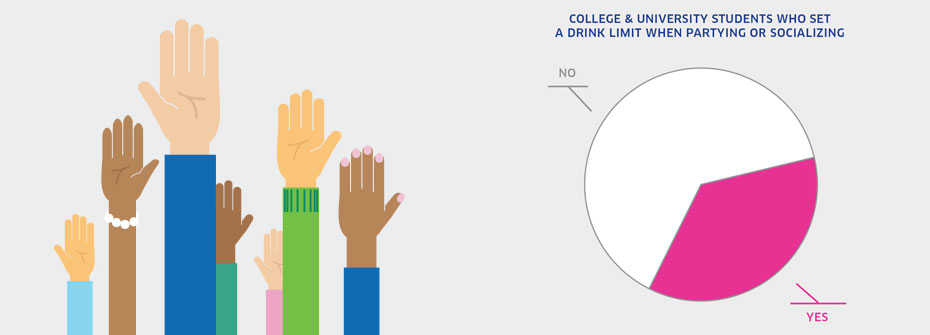
| COLLEGE & UNIVERSITY STUDENTS WHO SET A DRINK LIMIT WHEN PARTYING OR SOCIALIZING | Promotion and Prevention | 35.9 | ||
|
✕
Children And Youth
COLLEGE & UNIVERSITY STUDENTS WHO SET A DRINK LIMIT WHEN PARTYING OR SOCIALIZING
   About
What it tells us
Links to MHCC Activities
What it is:The percentage of college and university students who drink alcohol that reported determining in advance not to exceed a set number of drinks always or most of the time when partying or socializing in 2013. Source:American College Health Association, National College Health Assessment Canadian Reference Group Data Report (Spring 2013). Why it's important:Binge drinking is a leading cause of injury and death among college and university students. Prevention efforts in campus settings focus on encouraging students to limit the amount they drink on any one occasion as a means of reducing harms. Establishing a maximum number of alcoholic beverages before an event is a key strategy towards moderation. What it tells usAmong college and university students that drink, slightly over one-third report that they routinely set limits on the number of alcoholic drinks they will have when partying or socializing. This suggests the potential for heavy or binge drinking is high, as is the risk for associated harms. Hence, this indicator is coded red. Limitations:The National College Health Assessment survey included a sample of approximately 34,000 students in 32 post-secondary institutions. The mean response rate of 20% suggests that results may not represent the larger post-secondary population with complete accuracy. Determining in advance not to exceed a set number of drinks does not necessarily mean that the student will set a limit that is within low-risk guidelines or will, in fact, drink within the pre-determined limit.
|
||||
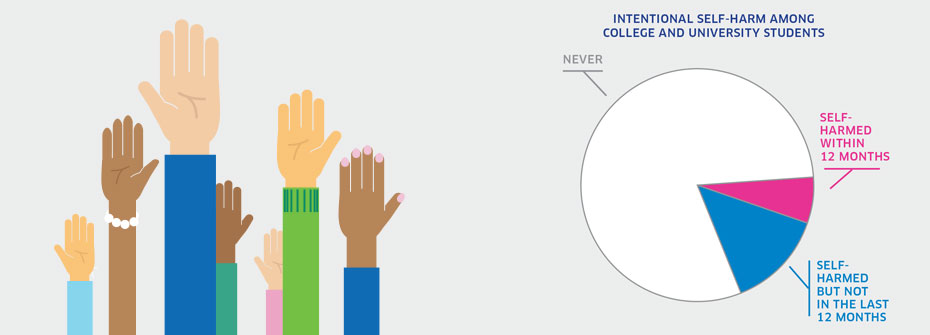
| INTENTIONAL SELF-HARM AMONG COLLEGE & UNIVERSITY STUDENTS | Promotion and Prevention | 6.6 | ||
|
✕
Children And Youth
INTENTIONAL SELF-HARM AMONG COLLEGE & UNIVERSITY STUDENTS
   About
What it tells us
Links to MHCC Activities
What it is:The percentage of Canadian college and university students in 2013 that reported having intentionally cut, burned, bruised, or otherwise injured themselves over the past 12 months. Source:American College Health Association, National College Health Assessment Canadian Reference Group Data Report (Spring 2013). Why it's important:While deliberate self-harm often occurs in the absence of suicidal intent, it is considered a clear sign of emotional distress that may result in accidental death or serious injury. Further, among those engaged in self-harm, are individuals who are at risk to die by suicide at a later date. What it tells usIntentional self-harm in the last 12 months was reported by 6.6% of students. Eighty percent indicated they had never intentionally harmed themselves, revealing that close to 20% had engaged in self-harm at some point in the past. This is a substantial rate of self-harm among college and university students and therefore is coded red. Limitations:The National College Health Assessment survey included a sample of approximately 34,000 students in 32 post-secondary institutions. The mean response rate of 20% suggests that results may not represent the larger post-secondary population with complete accuracy.
|
||||
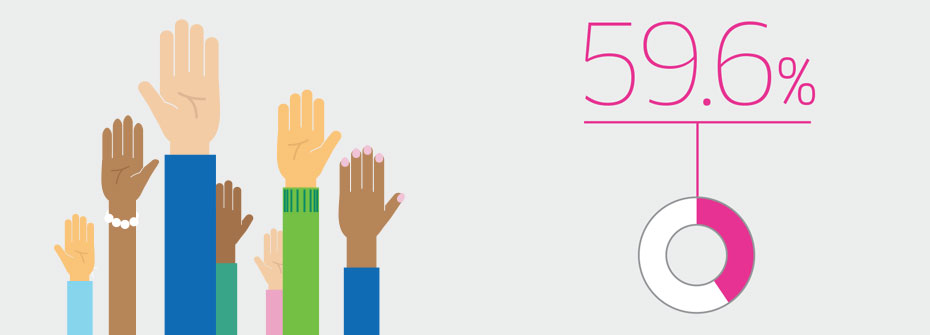
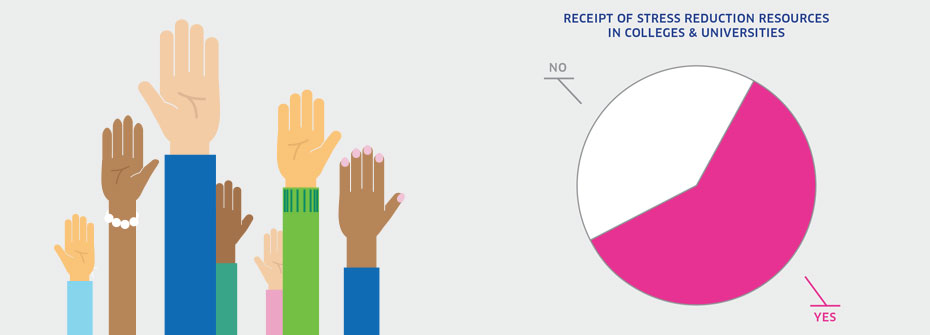
| RECEIPT OF STRESS REDUCTION RESOURCES IN COLLEGES & UNIVERSITIES | Promotion and Prevention | 59.6 | ||
|
✕
Children And Youth
RECEIPT OF STRESS REDUCTION RESOURCES IN COLLEGES & UNIVERSITIES
   About
What it tells us
Links to MHCC Activities
What it is:The percentage of college and university students that reported having received information about stress reduction from their post-secondary institution in 2013. Source:American College Health Association, National College Health Assessment Canadian Reference Group Data Report (Spring 2013). Why it's important:The emergence of mental health problems in adolescence and early adulthood makes post-secondary institutions a key setting in which to provide mental health supports. The extent to which students are receiving resource materials on managing stress is one indicator of campus mental health promotion capacity. What it tells usApproximately three out of five students report that they received stress reduction information on campus. This is very similar to results found in the same survey of college students in the United States (56.8%). Given the potential for greater distribution, this indicator is coded yellow. Limitations:The National College Health Assessment survey included a sample of approximately 34,000 students in 32 post-secondary institutions. The mean response rate of 20% suggests that results may not represent the larger post-secondary population with complete accuracy. In addition, receipt of information does not necessarily mean the information was helpful.
|
||||
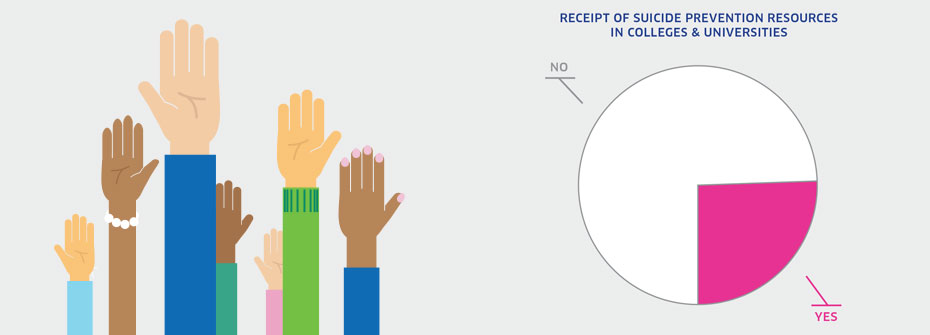
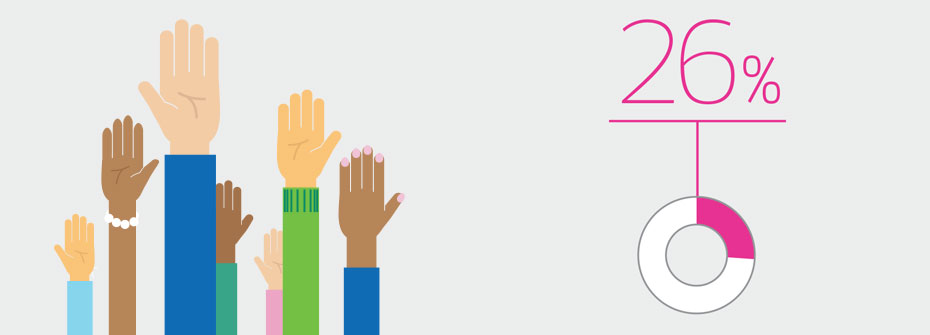
| RECEIPT OF SUICIDE PREVENTION INFORMATION IN COLLEGES & UNIVERSITIES | Promotion and Prevention | 25.4 | ||
|
✕
Children And Youth
RECEIPT OF SUICIDE PREVENTION INFORMATION IN COLLEGES & UNIVERSITIES
   About
What it tells us
Links to MHCC Activities
What it is:The percentage of college and university students that reported having received information from their college or university on suicide prevention in 2013. Source:American College Health Association, National College Health Assessment Canadian Reference Group Data Report (Spring 2013). Why it's important:Approximately one in five college and university students disclose that at some time in the past they have seriously considered suicide or have intentionally injured themselves. A larger proportion reports levels of depression that made it difficult to function. The elevated risk for suicide among these students suggests a need for on-site prevention initiatives in post-secondary institutions. What it tells usJust over one-quarter of students report that they received suicide prevention information from their post-secondary institution. Effective suicide prevention requires a multi-faceted strategy, now in place on many campuses across Canada. It is not known from the data how prevention information was distributed and whether it was directed to those at higher risk. Uncertainty in interpreting this indicator has resulted in a yellow coding. Limitations:The National College Health Assessment survey included a sample of approximately 34,000 students in 32 post-secondary institutions. The mean response rate of 20% suggests that results may not represent the larger post-secondary population with complete accuracy. In addition, receipt of information does not necessarily mean the information was helpful.
|
||||
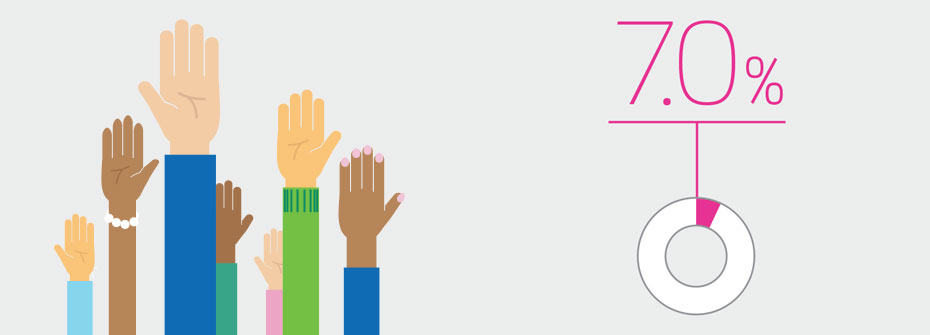
| SCHOOL-BASED MENTAL HEALTH PROMOTION | Promotion and Prevention | 7.0 | ||
|
✕
Children And Youth
SCHOOL-BASED MENTAL HEALTH PROMOTION
   About
What it tells us
Links to MHCC Activities
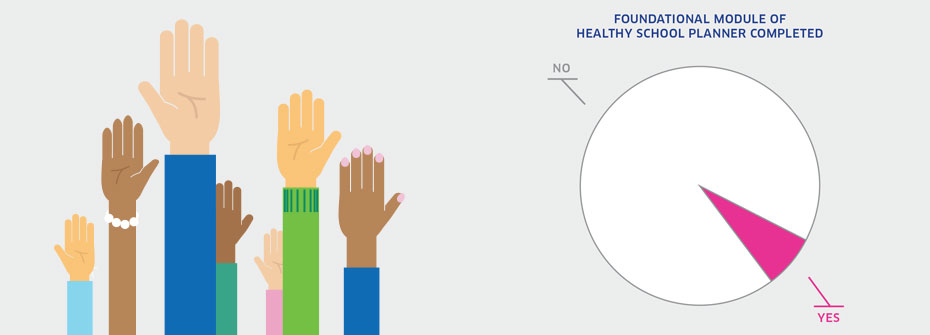
What it is:The percentage of Canadian schools that have completed the Foundational Module of the Healthy School Planner (HSP-FM), developed by the Pan-Canadian Joint Consortium for School Health (JCSH), between November 2012 and June 2014. Source:Data were obtained from the Pan-Canadian Joint Consortium for School Health, and Propel Centre for Population Health Impact, University of Waterloo (years November 2012—June 2014). Why it's important:Schools are a logical setting in which to promote the health and wellbeing of children and youth. The number of schools that use a comprehensive school health approach in planning for a healthier school environment is one measure of the extent to which schools are interested, and involved, in creating healthy school communities. The JCSH HPS-FM includes a focus on the school’s social environment which addresses factors closely linked to mental health promotion in the school setting. Healthy school communities have the potential to protect against mental health problems. What it tells usThere are over 14,000 schools in Canada. 7% or 1,012 schools have completed the HSP-FM. The revised version of the JCSH’s Healthy School Planner (which, for the first time, included the Foundational Module) was only launched in November 2012. As such, time to see the trend in uptake is short, and hence this indicator is coded yellow. Limitations:Completion of the HSP-FM does not necessarily imply that the recommended actions are being implemented. Conversely, the rate of uptake of the module may underestimate the number of schools using comprehensive school health approaches in planning for a healthier school.
|
||||
| SELF-RATED MENTAL HEALTH – YOUTH | Promotion and Prevention | 77.2 | ||
|
✕
Children And Youth
SELF-RATED MENTAL HEALTH – YOUTH
   About
What it tells us
Links to MHCC Activities
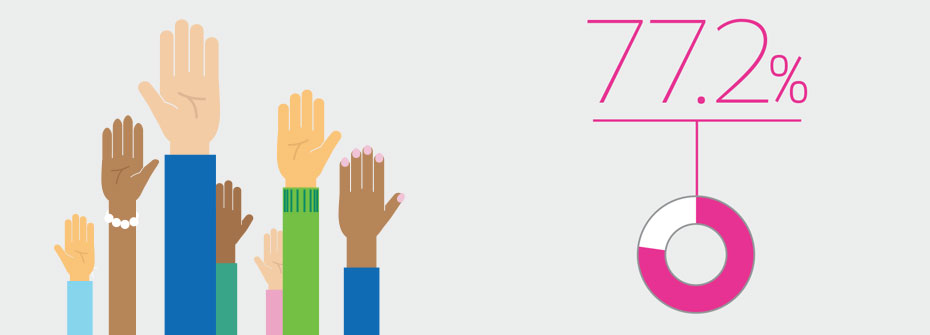
What it is:The percentage of Canadians aged 12 to 19 years that reported their mental health as very good or excellent in 2011/2012. Source:Canadian Community Health Survey, Public Use Microdata File, Statistics Canada (years 2003, 2005, 2007/08, 2009/10, 2011/12). Also available from CANSIM table 105-0501. Why it's important:Mentally healthy youth perform well at home, in school, and in their communities. Good mental health in adolescence is associated with good mental health and quality of life in adulthood. Poor mental health in youth can signal a lack of resilience, the presence of stressors and/or other vulnerabilities. What it tells usOver three-quarters of adolescents report their own mental health as being very good or excellent, a finding that has been stable since 2003. The percentage exceeds the rate in adults and seniors. Therefore, the indicator is coded green. Limitations:When taken as a measure of the entire youth population, lower or higher rates of self-reported mental health among distinct groups can be masked. High self-rated mental health does not necessarily mean an absence of mental illness.
|
||||
| SERIOUS CONSIDERATION OF SUICIDE - YOUTH | Promotion and Prevention | 6.4 | ||
|
✕
Children And Youth
SERIOUS CONSIDERATION OF SUICIDE - YOUTH
   About
What it tells us
Links to MHCC Activities
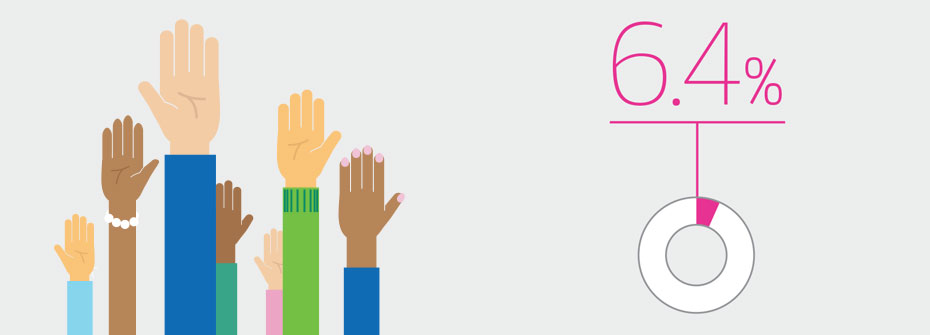
What it is:The percentage of Canadians aged 15 to 19 years that reported, in 2012, having seriously thought about suicide or taking their own life in the last 12 months. Source:Canadian Community Health Survey, Mental Health Supplement, Public Use Microdata File, Statistics Canada (years 2002 and 2012). Why it's important:Youth who disclose thoughts of suicide are regarded as at higher risk for suicidal behaviour. While the majority of youth with these thoughts will not make an attempt to end their life, serious consideration of suicide is associated with emotional distress and more severe forms of depression, warranting immediate attention by a health professional. What it tells usThe percentage of youth reporting serious consideration of suicide has not changed over the last decade. Serious consideration of suicide is much more common in youth than in other age groups. Hence, this indicator is coded red. Limitations:In 2002, data collection issues meant that some results had to be imputed.
|
||||
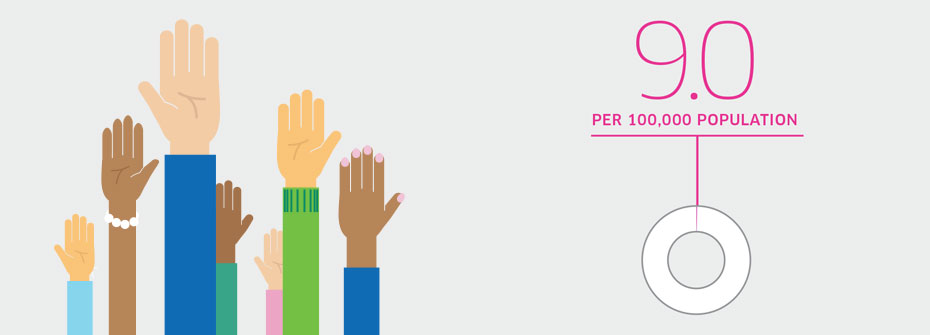
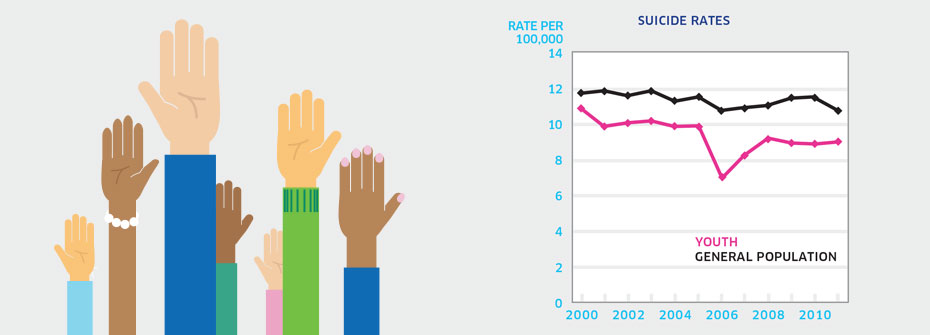
| SUICIDE RATES - YOUTH | Promotion and Prevention | 9.0 PER 100,000 | ||
|
✕
Children And Youth
SUICIDE RATES - YOUTH
   About
What it tells us
Links to MHCC Activities
What it is:The rate of suicide per 100,000 Canadians aged 15 to 19 years in 2011. Source:Statistics Canada CANSIM Table 102-0551. Why it's important:Suicide is the second leading cause of death among Canada’s youth. Compared to other age groups, youth are more likely to report suicidal thoughts and self-harm, elevating their risk for a suicide attempt. As well, young people are often not aware of avenues for help. What it tells usAt a rate of 9.0 per 100,000, the rate of suicide in youth aged 15 to 19 years is slightly lower than that for the general population. While the rate for this age group has decreased from 2003 (10.9), the amount of change over this period is not different from variations observed over longer time periods. This indicator is coded red given the failure to dramatically reduce youth suicide in Canada. Limitations:Investigations of cause of death can be difficult and consequently the determination of death by suicide may not always be accurate.
|
||||
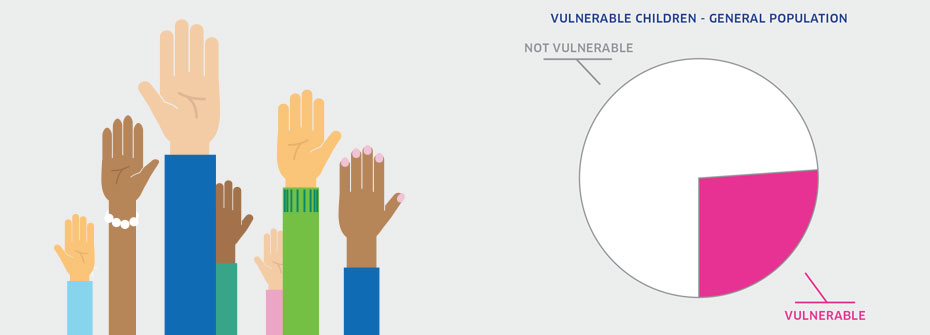
| VULNERABLE CHILDREN – GENERAL POPULATION | Promotion and Prevention | 26.0 | ||
|
✕
Children And Youth
VULNERABLE CHILDREN – GENERAL POPULATION
   About
What it tells us
Links to MHCC Activities
What it is:The percentage of kindergarten-aged children identified as vulnerable on one or more of five dimensions reflecting emotional, social, and cognitive development on the Early Development Instrument (EDI) collected over the period 2007/2008 to 2011/2012. Source:Special data request made to the Offord Centre for Child Studies, McMaster University.. Why it's important:Healthy early child development is strongly associated with wellbeing over the lifespan. The EDI predicts poor school performance amongst students identified as vulnerable, which has implications for health, including mental health, and social outcomes throughout the lifespan. Identifying population-based vulnerability in relation to neighbourhoods, communities, regions, and other distinct factors can help focus efforts on where to provide additional support and mitigate the risks for vulnerable children. What it tells usA child is considered vulnerable in a domain when their results fall below a level established by the EDI. Over one-quarter of children entering school were identified as vulnerable in at least one of five core areas of early child development. Consequently, this indicator is coded red. Limitations:Pan-Canadian data are compiled from the single most recent EDI data collection in any province. Province or territory-wide data were available from nine of the 13 provinces and territories.
|
||||
 Diversity |
||||
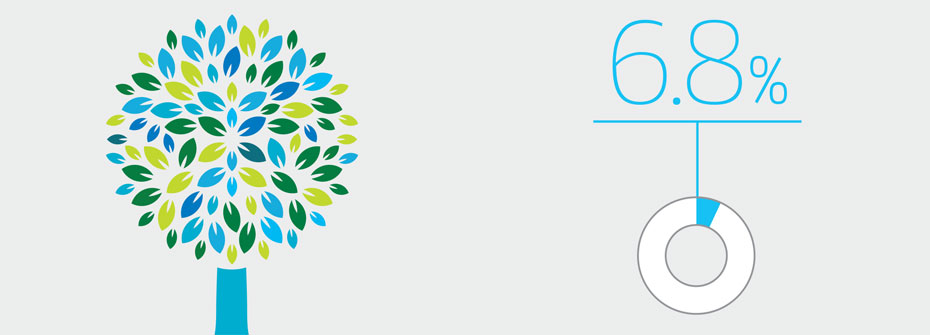
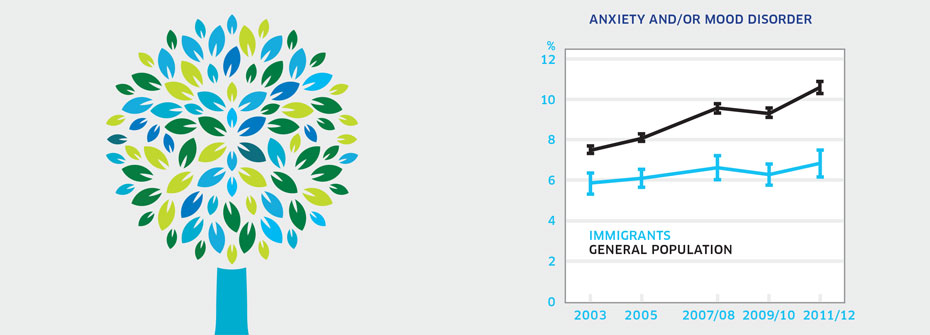
| ANXIETY AND/OR MOOD DISORDERS – IMMIGRANTS | Disparities and Diversity | 6.8 | ||
|
✕
Diversity
ANXIETY AND/OR MOOD DISORDERS – IMMIGRANTS
   About
What it tells us
Links to MHCC Activities
What it is:The percentage of immigrants aged 12 years or older that reported in 2011/2012 that they have an anxiety disorder and/or mood disorder which has been diagnosed by a health care professional. Source:Canadian Community Health Survey, Public Use Microdata File, Statistics Canada (years 2003, 2005, 2007/08, 2009/10, 2011/12). Why it's important:Immigrants to Canada may be vulnerable to mental health problems because of the difficulties associated with resettlement. What it tells usMultiple barriers in accessing health services faced by people may mean immigrants are less likely to receive a diagnosis from a health care professional even when they are experiencing symptoms. The percentage of immigrants reporting a diagnosis of anxiety disorder or mood disorder is lower than that found in the general population and remains unchanged over the last decade. While the lower rate of anxiety and/or mood disorders among immigrants may be a promising finding, it also could be due to under-reporting and under-detection. Given this uncertainty, this indicator is coded yellow. Limitations:Self-reports of diagnosed anxiety and mood disorders are based on single survey questions and may not correspond to prevalence rates based on epidemiologic studies. Immigrants are highly diverse and include those who entered Canada as refugees and those who have been in Canada for varying lengths of time. Individuals with serious health conditions are typically denied entry which could affect reported illness rates. Reported receipt of a diagnosis for an anxiety and/or mood disorder does not necessarily imply receipt of treatment.
|
||||
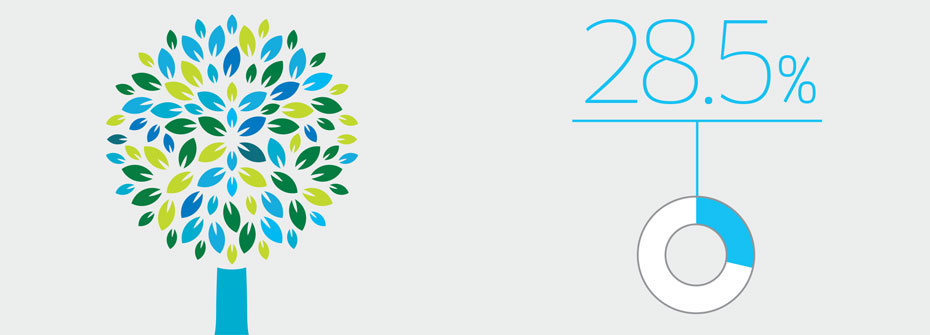
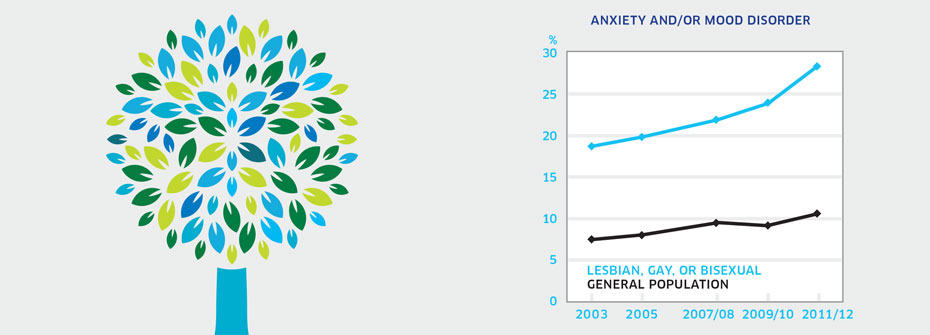
| ANXIETY AND/OR MOOD DISORDERS - LESBIAN, GAY, OR BISEXUAL INDIVIDUALS | Disparities and Diversity | 28.5 | ||
|
✕
Diversity
ANXIETY AND/OR MOOD DISORDERS - LESBIAN, GAY, OR BISEXUAL INDIVIDUALS
   About
What it tells us
Links to MHCC Activities
What it is:The percentage of Canadians aged 12 years or older that identified themselves as lesbian, gay, or bisexual and reported in 2011/2012 that they have an anxiety disorder and/or mood disorder which has been diagnosed by a health care professional. Source:Data were obtained using a special tabulations request from Statistics Canada. Why it's important:Lesbian, gay, and bisexual individuals are more vulnerable to mental health conditions, including anxiety and/or mood disorders. The experience of stigma and discrimination is believed to contribute to the elevated risk of mental health problems. As well, lesbian, gay, and bisexual individuals may experience inequities in the receipt of health services for mental health problems. What it tells usReported rates of anxiety and/or mood disorders are greatly elevated in lesbian, gay, and bisexual populations. Just under 30% report having received one or both of these diagnoses compared to 10.6% of general population respondents. Hence, this indicator is coded red. Limitations:Self-reports of diagnosed anxiety and mood disorders are based on single survey questions and may not correspond to prevalence rates based on epidemiologic studies. A large proportion of individuals did not respond to the question about sexual orientation, potentially limiting the accuracy of this indicator. Reported receipt of a diagnosis for an anxiety and/or mood disorder does not necessarily imply receipt of treatment. The survey question only includes lesbian, gay, or bisexual and excludes other sexual identities such as intersex, transgender, queer, and questioning.
|
||||
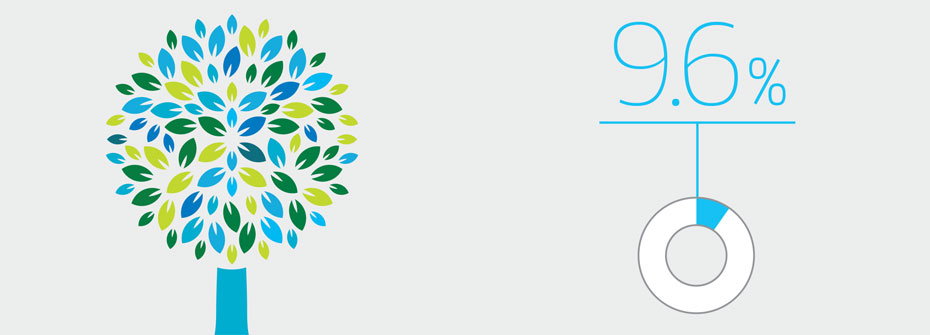
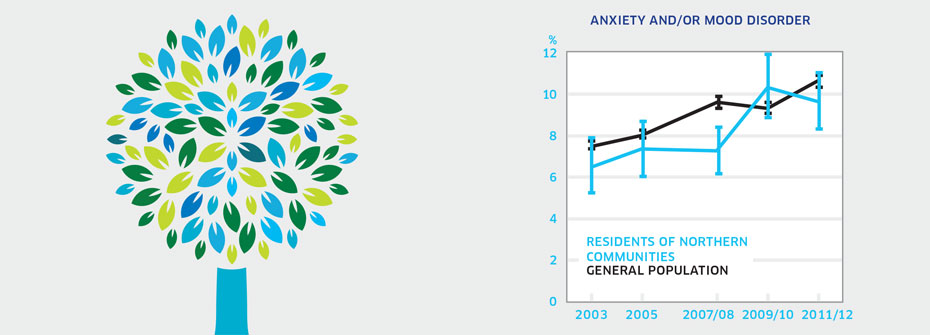
| ANXIETY AND/OR MOOD DISORDERS - RESIDENTS OF NORTHERN COMMUNITIES | Disparities and Diversity | 9.6 | ||
|
✕
Diversity
ANXIETY AND/OR MOOD DISORDERS - RESIDENTS OF NORTHERN COMMUNITIES
   About
What it tells us
Links to MHCC Activities
What it is:The percentage of Canadians aged 12 or older living in the three territories that reported in 2011/2012 that they have an anxiety disorder and/or mood disorder which has been diagnosed by a health care professional. Source:Canadian Community Health Survey, Public Use Microdata File, Statistics Canada (years 2003, 2005, 2007/08, 2009/10, 2011/12). Why it's important:People in Northern communities may be more vulnerable to mental health conditions, including anxiety and/or mood disorders, than people in non-Northern regions of Canada. This may result from social and economic disparities, access and transportation issues and, in many communities, limited health care resources. What it tells usThe rate of reported anxiety disorders and/or mood disorders among people living in Canadian territories in 2011/2012 (9.6%) is higher than in 2003 (6.5%). Limited access to mental health professionals and language/cultural barriers may result in fewer diagnoses. While it might appear as though these disorders are on the rise, increasing rates may instead reflect better detection and diagnosis by health care professionals, particularly family doctors who would see the large majority of such individuals. Due to this uncertainty, this indicator is coded yellow. Limitations:Self-reports of diagnosed anxiety and mood disorders are based on single survey questions and may not correspond to prevalence rates based on epidemiologic studies. Restricting this indicator to survey results from the three territories does not represent all Canadians living in Northern and remote communities. Small sample sizes in Northern communities can affect the accuracy of some results. Reported receipt of a diagnosis for an anxiety and/or mood disorder does not necessarily imply receipt of treatment.
|
||||
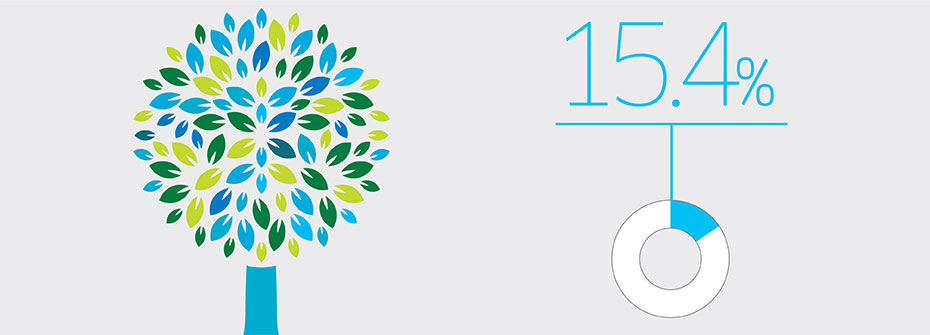
| DISCRIMINATION – GENERAL POPULATION | Disparities and Diversity | 15.4 | ||
|
✕
Diversity
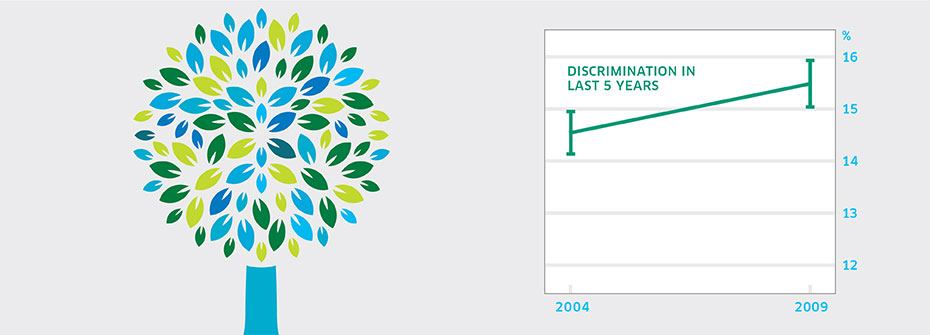
DISCRIMINATION – GENERAL POPULATION
   About
What it tells us
Links to MHCC Activities
What it is:The percentage of Canadians aged 15 years or older that reported, in 2009, having experienced discrimination or been treated unfairly by others over the past five years. Source:General Social Survey, Statistics Canada, Cycle 23 (2009) and Cycle 18 (2004). Why it's important:Perceived discrimination increases the likelihood of both physical and mental health problems. Research evidence suggests that the experience of unfair treatment, rather than the reason for discrimination, is responsible for psychological distress. The occurrence of perceived discrimination across individuals with diverse socio-demographic characteristics suggests that it represents an important vulnerability factor in population health. What it tells usApproximately one in seven Canadians reported experiencing discrimination or unfair treatment over the past five years. While this represents a substantial proportion of the population, the rate is lower than that found in the United States. No significant difference was apparent between the 2009 and 2004 (14.6%) proportion reporting discrimination. Therefore this indicator is coded yellow. Limitations:The 2009 survey question pertaining to discrimination increased the number of reasons for discrimination to ten from nine. Physical appearance (other than skin colour) as a reason for discrimination had not been included in 2004 survey.
|
||||
| STRESS - IMMIGRANTS | Disparities and Diversity | 22.0 | ||
|
✕
Diversity
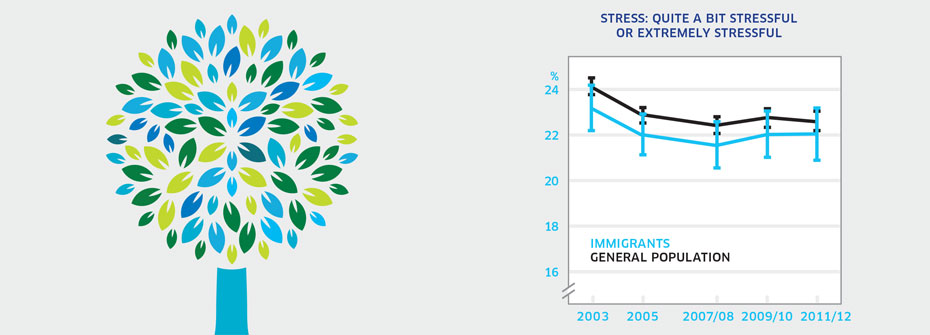
STRESS - IMMIGRANTS
   About
What it tells us
Links to MHCC Activities
What it is:The percentage of immigrants aged 15 years or older that reported that most days are quite a bit stressful or extremely stressful in 2011/2012. Source:Canadian Community Health Survey, Public Use Microdata File, Statistics Canada (years 2003, 2005, 2007/08, 2009/10, 2011/12). Why it's important:Stress is a known contributor to mental health problems. Acculturative stress is the psychological difficulty associated with adapting to a new culture. Immigration removes people from familiar contexts, families and friends, jobs, customs, and community networks. For some, the experience of immigration may increase stress and contribute to higher reported stress on most days. What it tells usThe proportion (22%) of immigrants that report high levels of stress most days is not dissimilar from the general population (22.6%) in 2011/2012 or previous years. Given this similarity and the relative stability of the rates since 2003, this indicator is coded yellow. Limitations:Immigrants are highly diverse and include those who entered Canada as refugees and those who have been in Canada for varying lengths of time.
|
||||
| STRESS - LESBIAN, GAY, OR BISEXUAL INDIVIDUALS | Disparities and Diversity | 34.3 | ||
|
✕
Diversity
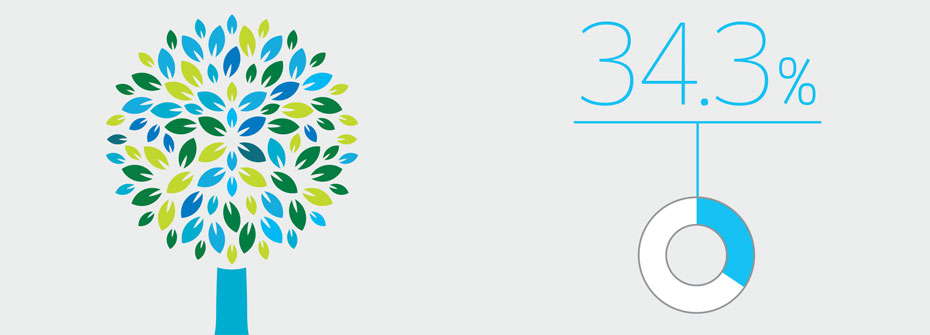
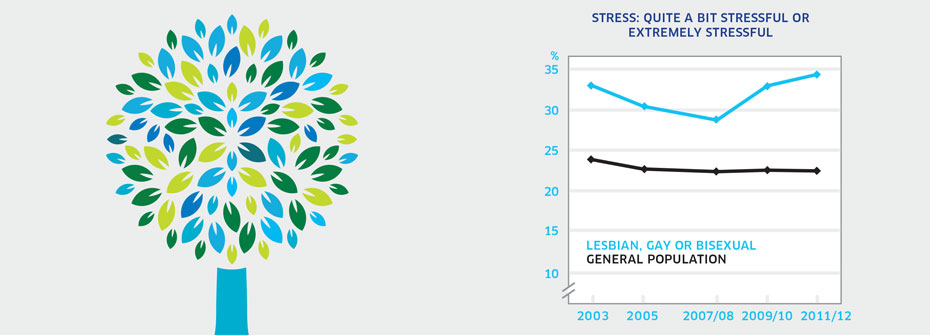
STRESS - LESBIAN, GAY, OR BISEXUAL INDIVIDUALS
   About
What it tells us
Links to MHCC Activities
What it is:The percentage of Canadians aged 15 years or older that identified themselves as lesbian, gay, or bisexual and reported that most days are quite a bit stressful or extremely stressful in 2011/2012. Source:Data were obtained using a special tabulations request from Statistics Canada. Why it's important:High levels of stress are associated with an elevated risk of mental health problems. Stress can result from stigma and discrimination which are more commonly experienced by lesbian, gay, and bisexual individuals than heterosexual individuals. Monitoring this indicator provides information on vulnerability associated with sexual orientation. What it tells usSlightly over one-third (34.3%) of lesbian, gay, or bisexual individuals report high levels of stress on most days. This is higher than the rate in the general population (22.6%) and as a result, this indicator is coded red. Limitations:A large proportion of individuals did not respond to the question about sexual orientation, potentially limiting the accuracy of this indicator. The survey question only includes lesbian, gay, or bisexual and excludes other sexual identities such as intersex, transgender, queer, and questioning.
|
||||
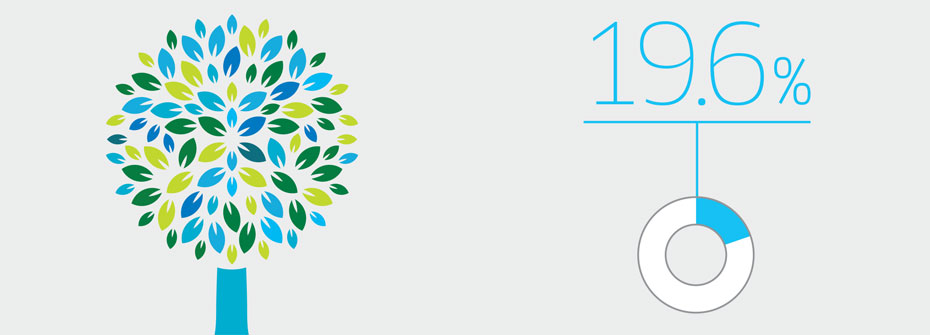
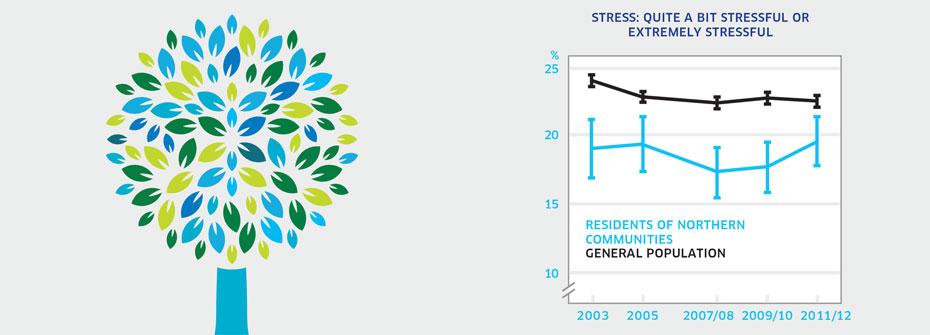
| STRESS - RESIDENTS OF NORTHERN COMMUNITIES | Disparities and Diversity | 19.6 | ||
|
✕
Diversity
STRESS - RESIDENTS OF NORTHERN COMMUNITIES
   About
What it tells us
Links to MHCC Activities
What it is:The percentage of Canadians aged 15 years or older living in the three Canadian territories that reported that most days are quite a bit stressful or extremely stressful in 2011/2012. Source:Canadian Community Health Survey, Public Use Microdata File, Statistics Canada (years 2003, 2005, 2007/08, 2009/10, 2011/12). Why it's important:Unemployment, low income, housing difficulties, transportation challenges, and under-servicing are among the issues faced by residents of Northern communities. These factors may increase the level of stress experienced by individuals who reside in these communities. What it tells usApproximately one in five residents of Northern communities report very high levels of stress. There is no evidence of change in reported stress since 2003. Northerners report lower stress than individuals living in non-Northern communities. Therefore this indicator is coded green. Limitations:Immigrants are highly diverse and include those who entered Canada as refugees and those who have been in Canada for varying lengths of time. Individuals with serious health conditions are typically denied entry which could contribute to high ratings of self-rated mental health.
|
||||
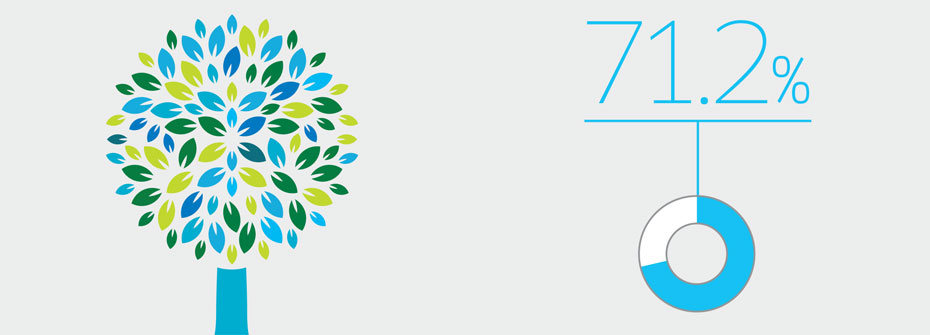
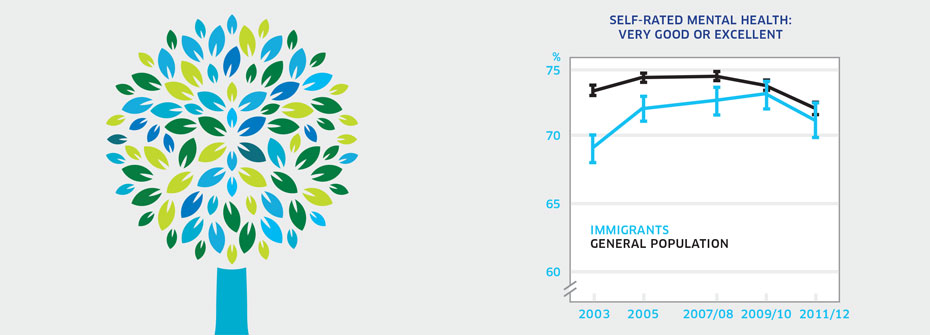
| SELF-RATED MENTAL HEALTH - IMMIGRANTS | Disparities and Diversity | 71.2 | ||
|
✕
Diversity
SELF-RATED MENTAL HEALTH - IMMIGRANTS
   About
What it tells us
Links to MHCC Activities
What it is:The percentage of immigrants aged 12 years or over that reported their mental health as very good or excellent in 2011/2012. Source:Canadian Community Health Survey, Public Use Microdata File, Statistics Canada (years 2003, 2005, 2007/08, 2009/10, 2011/12). Why it's important:Immigrants may face challenges associated with integration and adaptation to a new culture that can cause emotional strain and negatively affect mental health. What it tells usThe majority of immigrants (71.2%) report rates of very good or excellent mental health, which is similar to the general population (72.2%). This finding has been consistent over the past decade. Hence, this indicator is coded yellow. Limitations:Immigrants are highly diverse and include those who entered Canada as refugees and those who have been in Canada for varying lengths of time. Individuals with serious health conditions are typically denied entry which could contribute to high ratings of self-rated mental health. High self-rated mental health does not necessarily mean an absence of mental illness.
|
||||
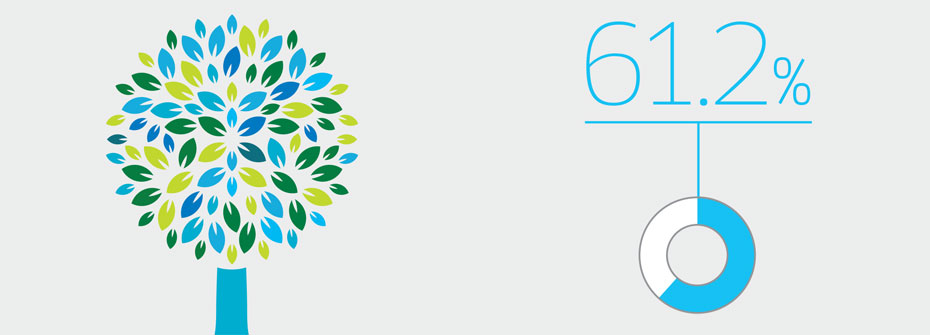
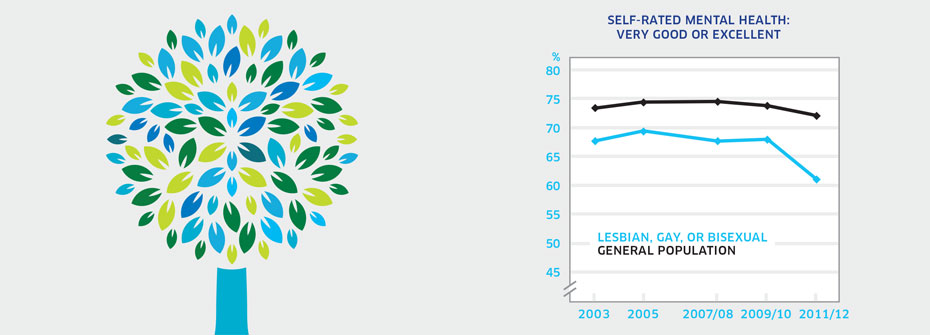
| SELF-RATED MENTAL HEALTH – LESBIAN, GAY, OR BISEXUAL INDIVIDUALS | Disparities and Diversity | 61.2 | ||
|
✕
Diversity
SELF-RATED MENTAL HEALTH – LESBIAN, GAY, OR BISEXUAL INDIVIDUALS
   About
What it tells us
Links to MHCC Activities
What it is:The percentage of self-rated lesbian, gay, or bisexual individuals aged 12 years or older that rated their mental health as very good or excellent in 2011/2012. Source:Data were obtained using a special tabulations request from Statistics Canada. Why it's important:Lesbian, gay, and bisexual individuals face risks to their mental health due to societal stigma and discrimination. Higher rates of mental illness have been found in these populations who may also experience challenges accessing informed and sensitive mental health care providers. What it tells usA lower percentage (61.2%) of lesbian, gay, and bisexual individuals report very good or excellent mental health compared to the general population (72.2%). In 2012, this discrepancy was considerably larger than in earlier years. Hence, this indicator is coded red. Limitations:A large proportion of individuals did not respond to the question about sexual orientation, potentially limiting the accuracy of this indicator. High self-rated mental health does not necessarily mean an absence of mental illness. The survey question only includes lesbian, gay, or bisexual and excludes other sexual identities such as intersex, transgender, queer, and questioning.
|
||||
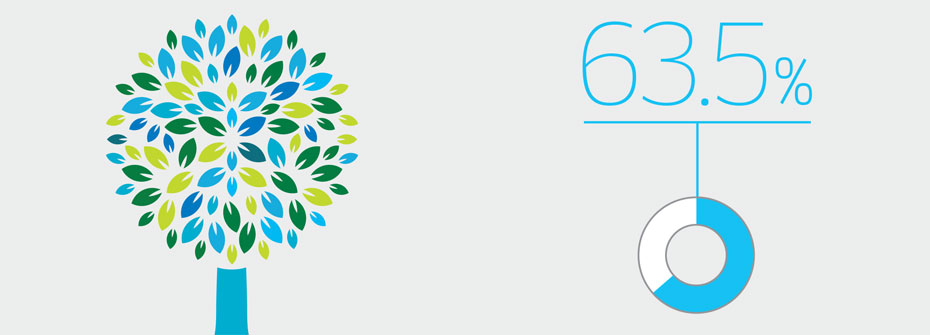
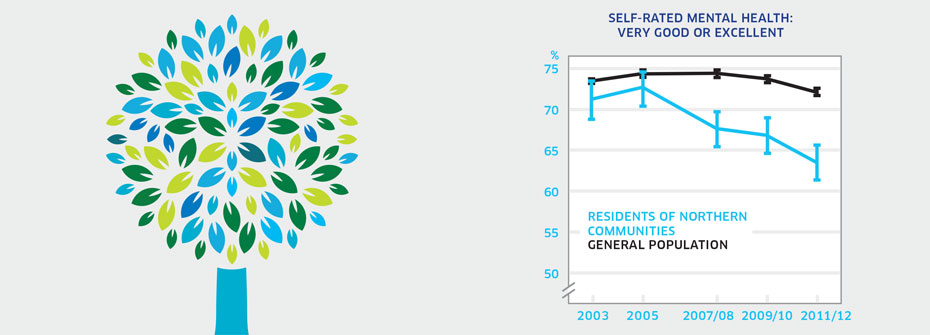
| SELF-RATED MENTAL HEALTH – RESIDENTS OF NORTHERN COMMUNITIES | Disparities and Diversity | 63.5 | ||
|
✕
Diversity
SELF-RATED MENTAL HEALTH – RESIDENTS OF NORTHERN COMMUNITIES
   About
What it tells us
Links to MHCC Activities
What it is:The percentage of Canadians aged 12 years or older living in the three territories that reported their mental health as very good or excellent in 2011/2012. Source:Canadian Community Health Survey, Public Use Microdata File, Statistics Canada (years 2003, 2005, 2007/08, 2009/10, 2011/12). Also available from CANSIM table 105-0501. Why it's important:People in Northern communities tend to have poorer mental health status than people in non-Northern regions of Canada. Reasons for this include social and economic disparities, access and transportation issues and, in many communities, limited health care resources. What it tells us63.5% of Canadians residing in the three territories report that their mental health is very good or excellent. This is a decline from rates found in earlier years. It is also considerably lower than mental health ratings among the general Canadian population (72.2%). Therefore this indicator is coded red. Limitations:Restricting this indicator to survey results from the three territories does not represent all Canadians living in Northern and remote communities. Small sample sizes in Northern communities can affect the accuracy of some results. High self-rated mental health does not necessarily mean an absence of mental illness.
|
||||
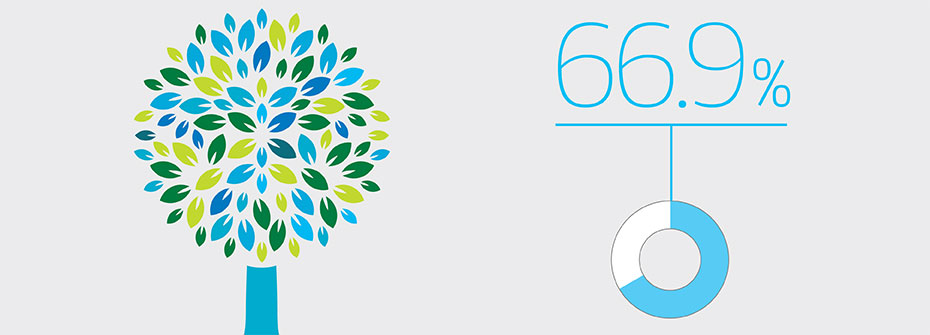
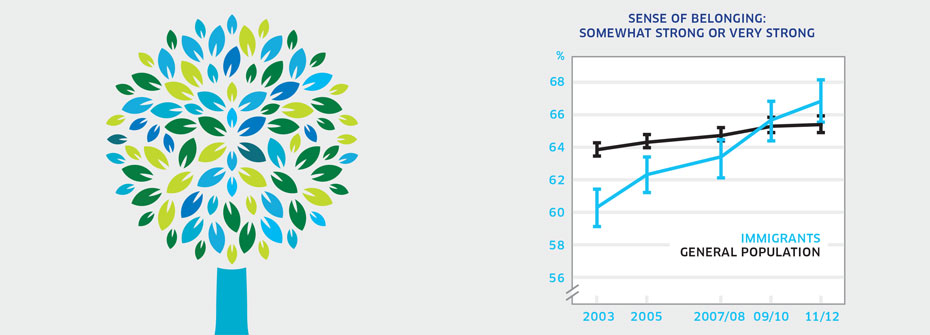
| SENSE OF BELONGING AMONG IMMIGRANTS | Disparities and Diversity | 66.9 | ||
|
✕
Diversity
SENSE OF BELONGING AMONG IMMIGRANTS
   About
What it tells us
Links to MHCC Activities
What it is:The percentage of immigrants aged 12 years or older that described their sense of belonging to their local community as somewhat strong or very strong in 2011/2012. Source:Canadian Community Health Survey, Public Use Microdata File, Statistics Canada (years 2003, 2005, 2007/08, 2009/10, 2011/12). Why it's important:Research has shown a relationship between community belonging and self-rated health status (both physical and mental). Immigrants may face challenges associated with integration and adaptation to a new culture, contributing to a weaker sense of community belonging. Conversely, immigrants with a strong sense of belonging should experience positive mental health. What it tells usApproximately two-thirds of immigrants in Canada report a strong sense of community belonging. This figure has increased consistently since 2003. Sense of belonging is slightly higher in immigrants who have been in Canada for more than ten years than those that have been here less than ten years. Furthermore, the percentage of immigrants reporting very strong belonging is higher than the general population. Consequently, this indicator is coded green. Limitations:The term local community may be interpreted in many ways. Individuals may feel a strong sense of belonging with a subgroup or subculture yet may not feel a sense of belonging to the broader community in which they live. Immigrants are highly diverse and include those who have resided in Canada for varying lengths of time and those who entered as refugees.
|
||||
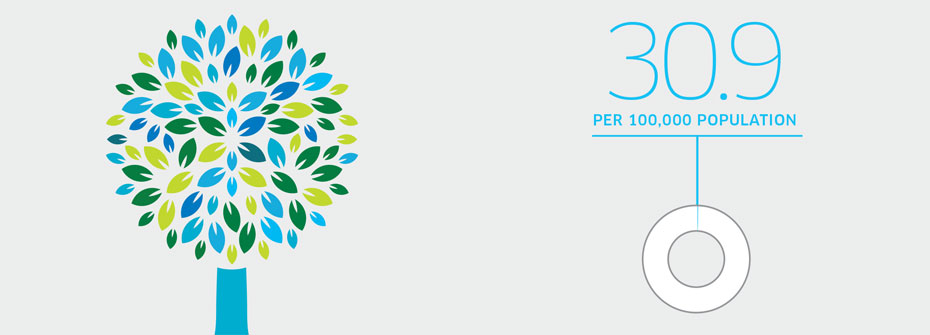
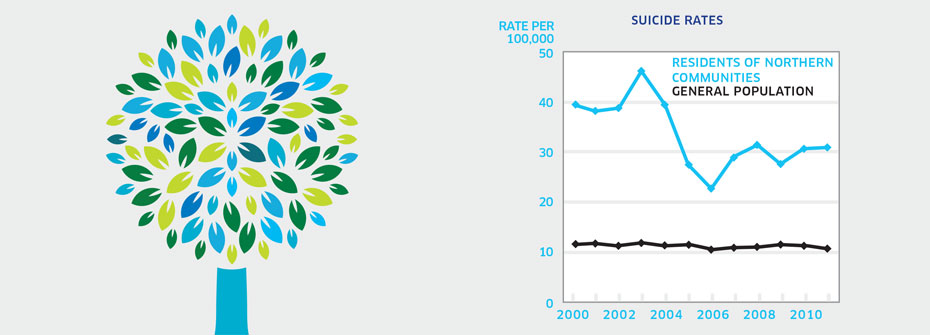
| SUICIDE RATES – RESIDENTS OF NORTHERN COMMUNITIES | Disparities and Diversity | 30.9 PER 100,000 | ||
|
✕
Diversity
SUICIDE RATES – RESIDENTS OF NORTHERN COMMUNITIES
   About
What it tells us
Links to MHCC Activities
What it is:The rate of suicide per 100,000 Canadians living in the three Canadian territories in 2011. Source:Statistics Canada CANSIM Table 102-0563 (and population data from Table 051-0001). Why it's important:People in Northern and rural communities tend to have poorer overall health and lower life expectancy than people in urban centres. Higher mortality rates are evident for all causes including suicide. What it tells usSuicide rates in the territories differ dramatically from rates for the rest of Canada. The rate of 30.9 suicide deaths per 100,000 is nearly three times that for the general population (10.8). While the high rate warrants a coding of red, it should be noted that despite some variability, the rate appears to decreasing over the past decade. Limitations:Restricting this indicator to survey results from the three territories does not represent all Canadians living in Northern and remote communities. Populations in these regions are small and when rates are expressed in terms of cases per 100,000 a change in the number of suicide deaths will result in a larger change in the rate. Investigations of cause of death can be difficult and consequently the determination of death by suicide may not always be accurate.
|
||||
 Economic Prosperity |
||||
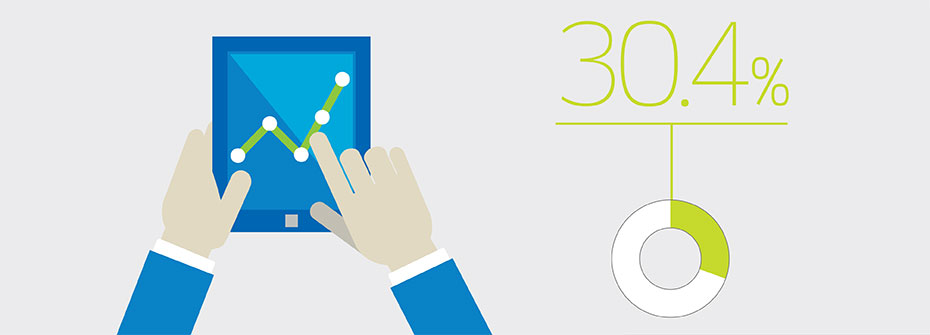
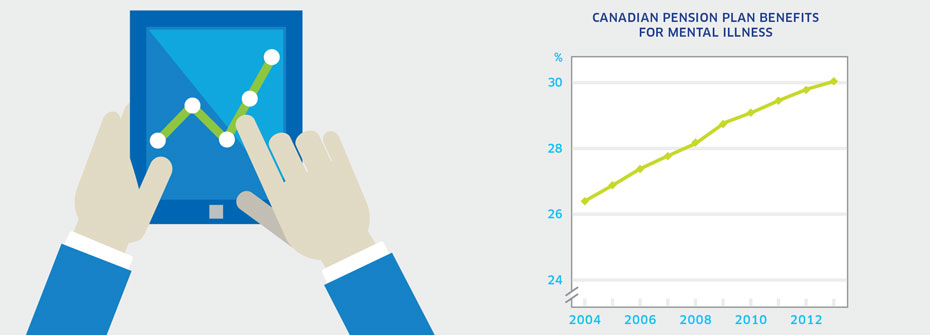
| MENTAL ILLNESS-RELATED DISABILITY CLAIMS | Promotion and Prevention | 30.4 | ||
|
✕
Economic Prosperity
MENTAL ILLNESS-RELATED DISABILITY CLAIMS
   About
What it tells us
Links to MHCC Activities
What it is:The percentage of Canadian Pension Plan (CPP) disability beneficiaries whose claims were related to mental disorders in 2013. Source:Service Canada: Canada Pension Plan Disability Benefits by Class of Diagnosis for years 2012-2013. Data from 2004-2011 were obtained from Statistics Canada. Why it's important:Mental illness can interfere with the ability to work and to function in other areas of life. As the economic and social impact of mental health related disability is considerable, efforts to address and support workers' mental health are important. What it tells us99,203 Canadians received CPP disability benefits for mental health reasons in 2013, representing 30.4% of all claims. As a proportion, this figure has steadily increased since 2004. Mental disorders are the largest diagnostic class when compared to disability benefits for other health reasons. While it might be concluded that the number of people unable to work because of mental illness is increasing over time, it may also be that decreasing stigma has resulted in a growing understanding that mental illness represents a legitimate reason for compensable disability. As a result of this uncertainty, this indicator is coded yellow. Limitations:This indicator does not capture short-term work-related disability associated with mental illness and only reflects individuals who have made sufficient Canada Pension Plan contributions and have mental health disabilities that prevent regular work in any job. Consequently, this indicator likely underestimates mental health work-related disability.
|
||||
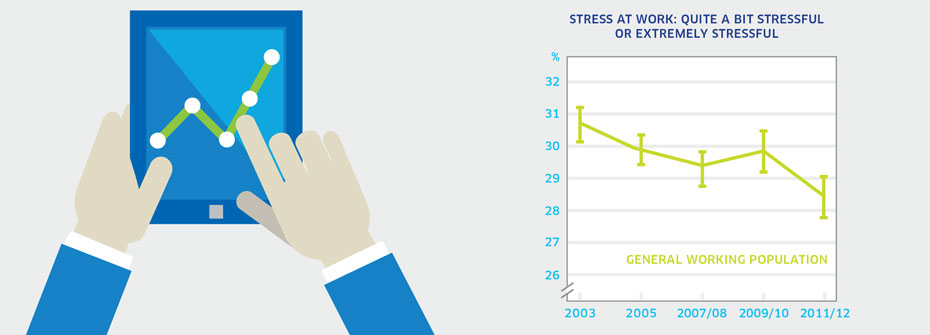
| STRESS AT WORK | Promotion and Prevention | 28.4 | ||
|
✕
Economic Prosperity
STRESS AT WORK
   About
What it tells us
Links to MHCC Activities
What it is:The percentage of Canadians aged 15 to 75 in 2012 that worked over the past year and reported that most days at work are quite a bit stressful or extremely stressful in 2011/2012. . Source:Canadian Community Health Survey, Statistics Canada, Public Use Microdata File, Statistics Canada (years 2003, 2005, 2007/08, 2009/10, 2011/12. Why it's important:Work-related stress extracts a huge fiscal and social toll in Canada. Stress associated with the workplace lowers productivity, increases short- and long-term absences and contributes to mental health problems among workers. What it tells usMore than one-quarter of Canadian workers perceived work-associated stress to be high. While this rate has declined slightly since 2003 and 2005 there remains a substantial proportion of workers who are highly stressed most of their working days. Consequently, this indicator is coded yellow. Limitations:When taken as a measure of the entire working age population, rates of perceived stress for distinct groups can be masked.
|
||||
 Housing and Homelessness |
||||
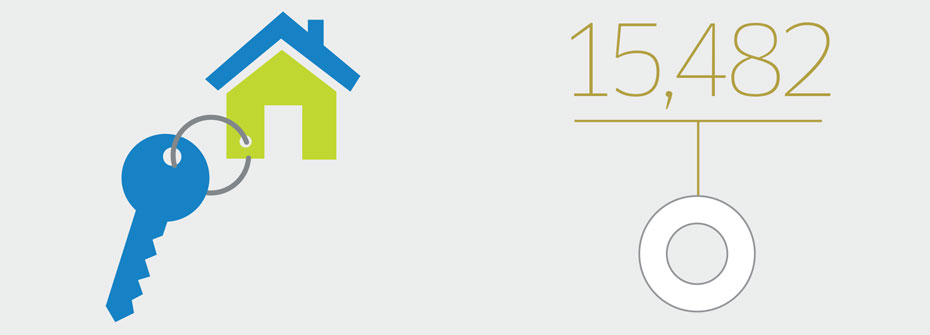
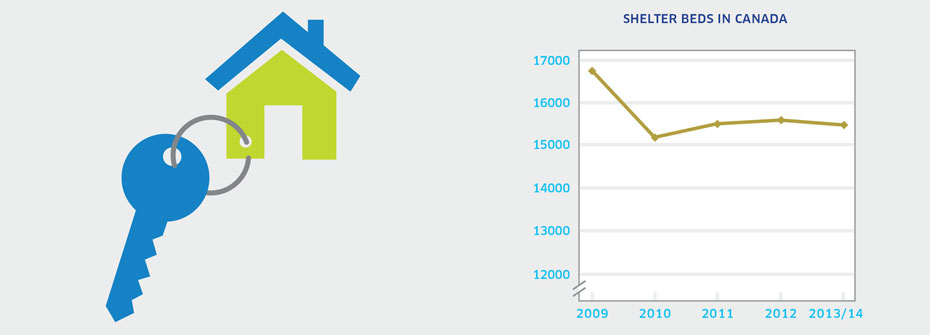
| EMERGENCY SHELTER CAPACITY | Access to Services |
15,482 SHELTER BEDS |
||
|
✕
Housing and Homelessness
EMERGENCY SHELTER CAPACITY
   About
What it tells us
Links to MHCC Activities
What it is:The number of emergency shelter beds in Canada in 2013/2014. Source:Human Resources and Skills Development Canada Shelter Capacity Reports (years 2009 to 2013/2014). Why it's important:Homelessness is one of the most significant societal problems in the country. Individuals with mental illness and addictions are over-represented in homeless populations. There are no data on the precise number of homeless Canadians. Estimates are as high as 30,000 homeless individuals per night. The number of emergency shelter beds is an indication of system capacity to provide shelter to homeless individuals. What it tells usThe number of emergency shelter beds in Canada has remained relatively stable over the last four years. However, bed capacity would appear not nearly sufficient to house the estimated number of individuals homeless on any given night. For these reasons, the indicator is coded yellow. Limitations:Shelter bed capacity estimates have become more accurate over time given better data collection and better classification of shelter types. It is not clear how this affects year-to-year comparisons and what appears to be a substantial drop in capacity since 2009 may be more of a measurement issue. The count of emergency shelter beds does not include transitional shelters and violence against women shelters.
|
||||
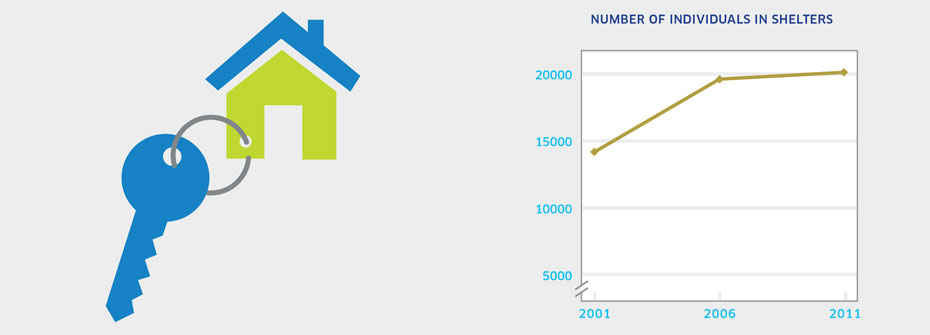
| NUMBER OF INDIVIDUALS LIVING IN SHELTERS | Access to Services | 20,170 INDIVIDUALS | ||
|
✕
Housing and Homelessness
NUMBER OF INDIVIDUALS LIVING IN SHELTERS
   About
What it tells us
Links to MHCC Activities
What it is:Canada Census count of the number of individuals identified through census data as living in a shelter in 2011. Source:Collective Dwelling Reports, Canada Census (years 2001, 2006, 2011). Why it's important:Homelessness is a national concern and many homeless individuals suffer from mental illness and addictions. Census data on the number of individuals that identify a shelter as their current residence helps estimate the number homeless in Canada. What it tells usApproximately 20,000 people reported residing in shelter in 2011 and this figure was unchanged from 2006. A significant increase was apparent between 2001 and 2006. Due to the uncertainty around if the increase is due to an actual increase in the numbers requiring shelter or if it simply reflects an increase in the number of shelter beds since 2001 this indicator is coded yellow. Limitations:Shelter definitions vary. Here, shelters include those for persons lacking a fixed address, shelters for abused women and children, and other shelters and lodging with assistance. Census data potentially underestimate the number of individuals in shelters because of the transient nature of this population as well as the challenges associated with tracking homeless individuals.
|
||||
 Population Wellbeing |
||||
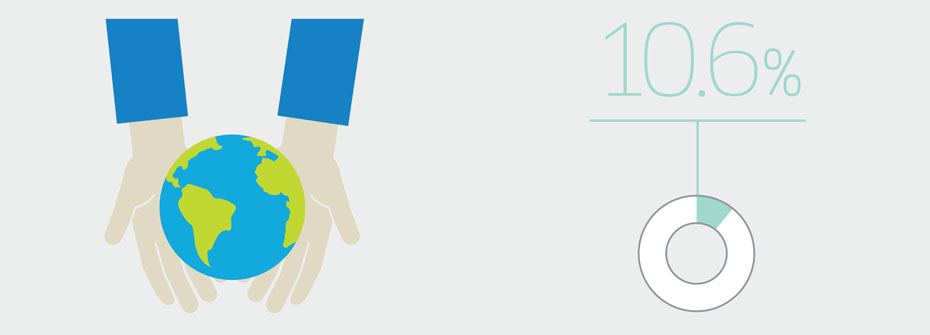
| ANXIETY AND/OR MOOD DISORDERS - GENERAL POPULATION | Promotion and Prevention | 10.6 | ||
|
✕
Population Wellbeing
ANXIETY AND/OR MOOD DISORDERS - GENERAL POPULATION
   About
What it tells us
Links to MHCC Activities
What it is:The percentage of Canadians aged 12 years or older that reported in 2011/2012 that they have an anxiety disorder and/or mood disorder which has been diagnosed by a health care professional. Source:Canadian Community Health Survey, Public Use Microdata File, Statistics Canada (years 2003, 2005, 2007/08, 2009/10, 2011/12). Why it's important:Anxiety and/or mood disorders are the most common mental health conditions and contribute to significant distress and impairment. Self-reports of diagnosed mental disorders provide one basis on which to assess mental health status of the general population. What it tells usSelf-reports of diagnosed anxiety and/or mood disorders are increasing over time. While it might appear as though these disorders are on the rise, increasing rates may instead reflect better detection and diagnosis by health care professionals, particularly family doctors who would see the large majority of such individuals. Due to this uncertainty, this indicator is coded yellow. Limitations:Self-reports of diagnosed anxiety and mood disorders are based on single survey questions and may not correspond to prevalence rates based on epidemiologic studies. Reported receipt of a diagnosis for an anxiety and/or mood disorder does not necessarily imply receipt of treatment.
|
||||
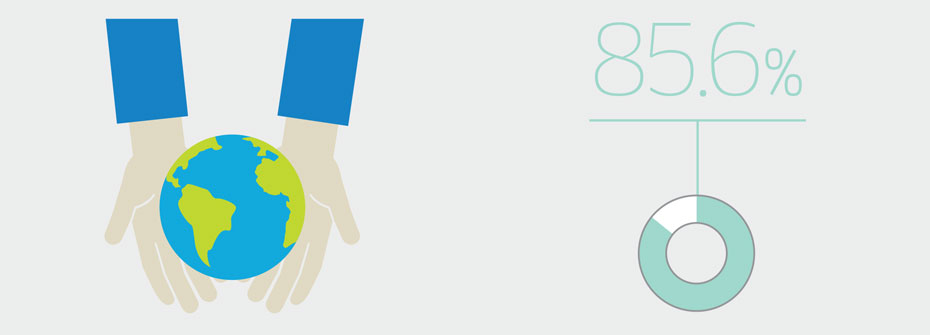
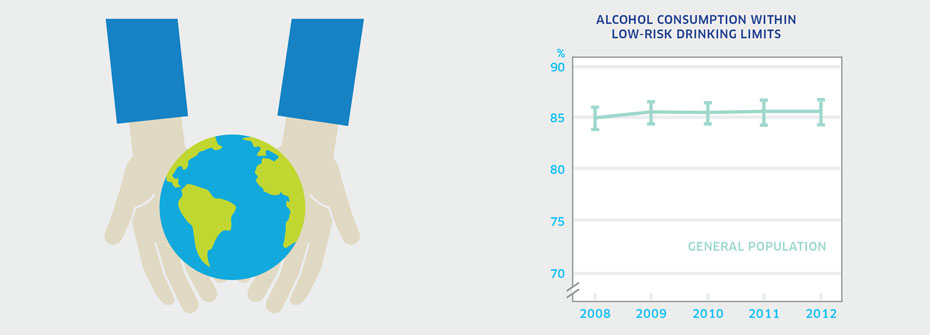
| LOW-RISK DRINKING | Promotion and Prevention | 85.6 | ||
|
✕
Population Wellbeing
LOW-RISK DRINKING
   About
What it tells us
Links to MHCC Activities
What it is:The percentage of Canadians aged 15 or older in 2012 that reported alcohol consumption within low-risk drinking limits. Source:Canadian Alcohol and Drug Use Monitoring Survey, Public Use Microdata Files, (years 2009 to 2012). Why it's important:Heavy drinking results in harm to individuals and society. High alcohol consumption on a population basis is associated with serious health and social consequences. People who misuse alcohol are at increased risk for depression, anxiety, and self-harm. Guidelines published by the Canadian Centre of Substance Abuse provide national standards for low-risk drinking recommending a maximum of 10 standard drinks per week for women and 15 standard drinks per week for men, with no more than 3 drinks per day most days. What it tells usA very high percentage of Canadians report that their alcohol consumption falls within low-risk drinking guidelines. There has been no significant change in this rate since 2008. Women are more likely (88.2%) than men (82.7%) to drink within the guidelines, a difference that holds over time. This indicator is coded yellow given that 15% of Canadians do not drink within the guidelines. Limitations:Recent research suggests that members of the public consistently underreport levels of alcohol consumption. The degree of underestimation is greater in younger drinkers than older drinkers.
|
||||
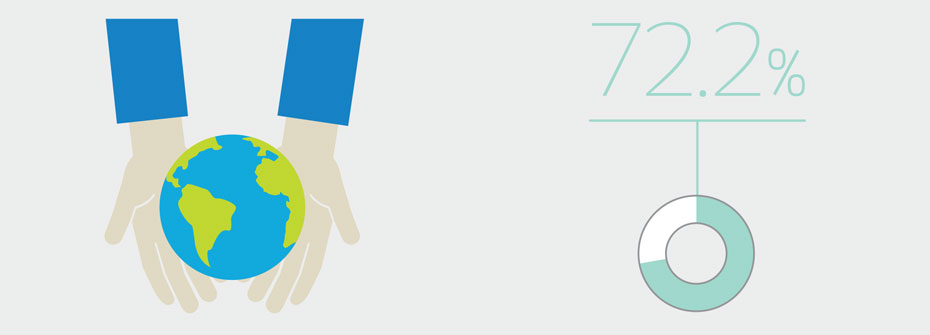
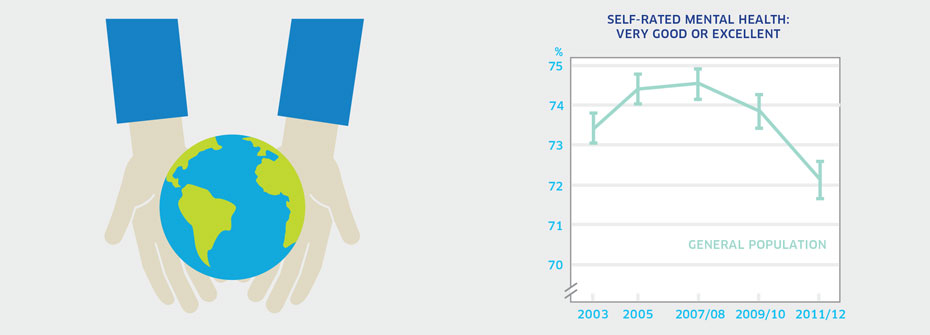
| SELF-RATED MENTAL HEALTH - GENERAL POPULATION | Promotion and Prevention | 72.2 | ||
|
✕
Population Wellbeing
SELF-RATED MENTAL HEALTH - GENERAL POPULATION
   About
What it tells us
Links to MHCC Activities
What it is:The percentage of Canadians aged 12 years or older that reported their mental health as very good or excellent in 2011/2012. Source:Canadian Community Health Survey, Public Use Microdata File, Statistics Canada (years 2003, 2005, 2007/08, 2009/10, 2011/12). Also available from CANSIM table 105-0501. Why it's important:Self-rated mental health is one of the accepted measures of health in the general population. Efforts to promote mental health and prevent problems before they develop should lead to improvements in this indicator. What it tells usThe majority of Canadians report their mental health as being very good or excellent although the rate has declined over time. Only a small percentage of Canadians feel their mental health is fair or poor (7.8%). This indicator is coded yellow because of the substantial drop in the most recent measurement period. Limitations:When taken as a measure of the entire population, lower or higher rates of mental health among distinct groups can be masked. High self-rated mental health does not necessarily mean an absence of mental illness.
|
||||
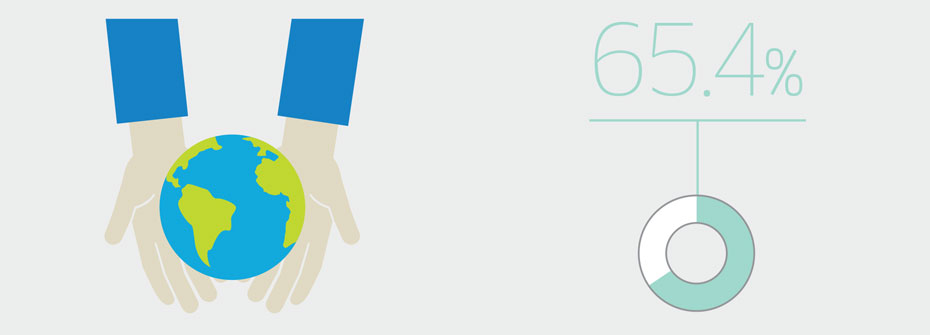
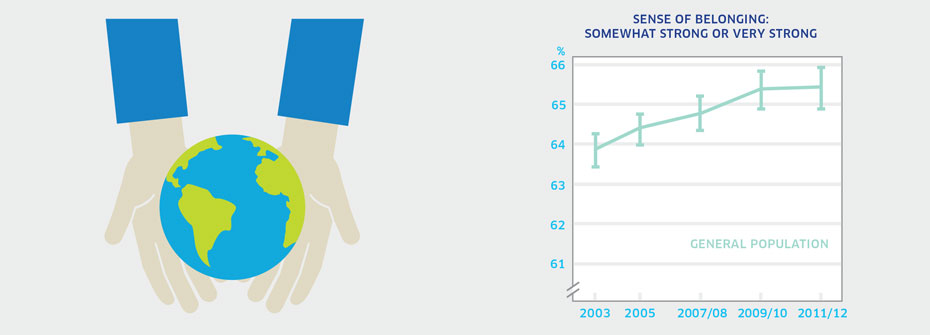
| SENSE OF BELONGING – GENERAL POPULATION | Promotion and Prevention | 65.4 | ||
|
✕
Population Wellbeing
SENSE OF BELONGING – GENERAL POPULATION
   About
What it tells us
Links to MHCC Activities
What it is:The percentage of Canadians aged 12 years or older that described their sense of belonging to their local community as somewhat strong or very strong in 2011/2012. Source:Canadian Community Health Survey, Public Use Microdata File, Statistics Canada (years 2003, 2005, 2007/08, 2009/10, 2011/12). Also available from CANSIM table 105-0501. Why it's important:Research has shown a relationship between community belonging and self-rated health status (both physical and mental). People who feel more connected to others in their community report higher levels of positive mental health and hence, belonging represents a protective factor. What it tells usNearly two-thirds of Canadians report a strong connection to their community. However, more than one-third report a weak or somewhat weak sense of belonging. While this indicator has risen slightly since 2003, it is coded as yellow because a substantial proportion of individuals do not have a strong sense of community belonging. Limitations:It should be noted that there are many different types of “community” (e.g., geographic, ethno-cultural, and organizational) for which a sense of belonging may be equally important in supporting wellbeing. As respondents were asked about their local community which implies geographic community, this indicator may underrepresent the sense of belonging in the general population. When taken as a measure of the entire population, rates of belonging for distinct groups can be masked.
|
||||
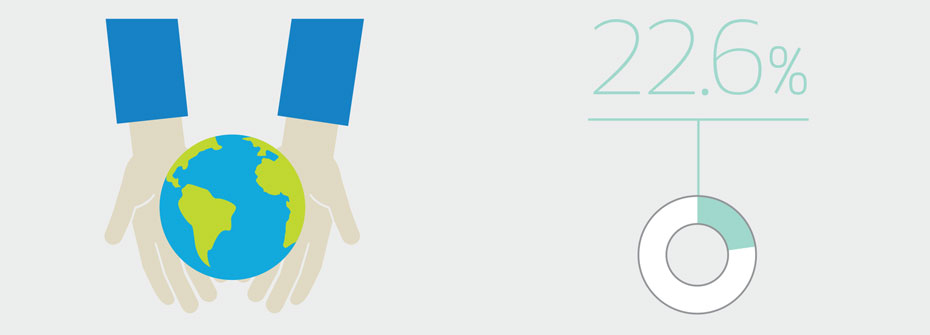
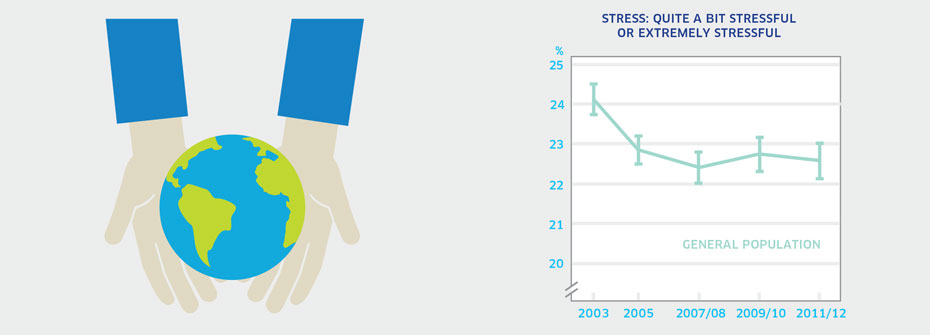
| STRESS - GENERAL POPULATION | Promotion and Prevention | 22.6 | ||
|
✕
Population Wellbeing
STRESS - GENERAL POPULATION
   About
What it tells us
Links to MHCC Activities
What it is:The percentage of Canadians aged 15 years or older that reported that most days are quite a bit stressful or extremely stressful in 2011/2012. Source:Canadian Community Health Survey, Public Use Microdata File, Statistics Canada (years 2003, 2005, 2007/08, 2009/10, 2011/12). Data also available from CANSIM table 105-0501 and 105-0503. Why it's important:Ongoing stress increases the risk of both physical and mental health problems. Excessive stress can often be prevented or reduced once it is recognized and the contributing factors addressed. What it tells usJust under one-quarter of Canadians (22.6%) report high levels of stress on a regular basis. Rates are quite stable over time although the proportion reporting extreme stress has fallen slightly since 2003. This indicator is coded yellow because there has been no real change in the relatively high levels of stress since 2005. Limitations:When taken as a measure of the entire population, rates of perceived stress for distinct groups can be masked.
|
||||
 Recovery |
||||
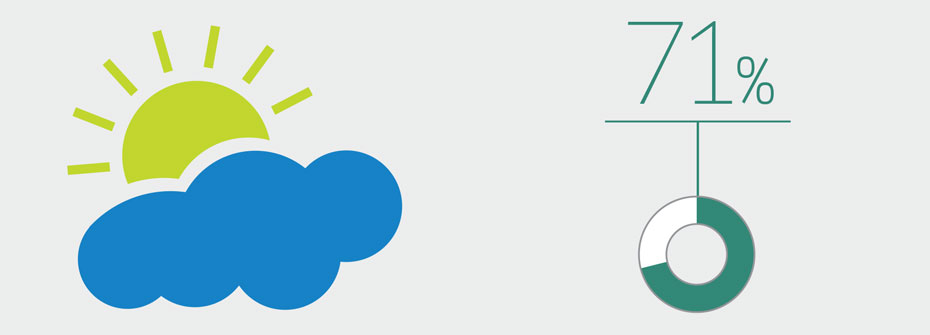
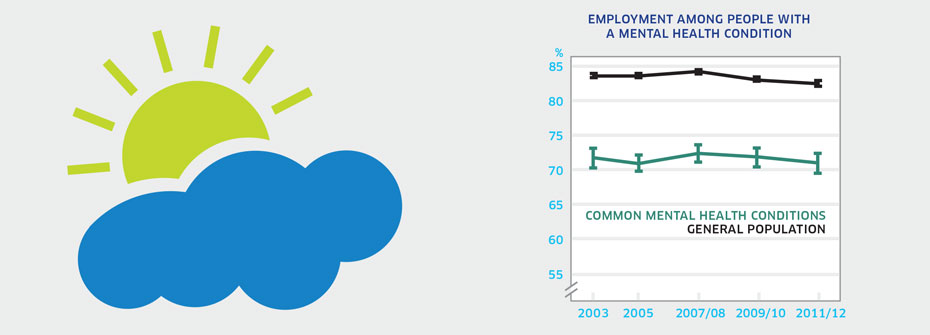
| EMPLOYMENT AMONG PEOPLE WITH COMMON MENTAL HEALTH CONDITIONS | Recovery and Rights | 71.0 | ||
|
✕
Recovery
EMPLOYMENT AMONG PEOPLE WITH COMMON MENTAL HEALTH CONDITIONS
   About
What it tells us
Links to MHCC Activities
What it is:The percentage of Canadians aged 12 years or older with common mental health conditions that reported in 2011/2012 that they worked at a job or business in the past 12 months. Source:Canadian Community Health Survey, Public Use Microdata File, Statistics Canada (years 2003, 2005, 2007/08, 2009/10, 2011/12). Why it's important:Participation in the workforce is an important aspect of recovery and wellbeing among people with mental illness. In Canada, employers are required to make reasonable accommodation, thus allowing employees with disability, including those with mental illness, to work despite some functional limitations. What it tells usThe percentage of people with a common mental health condition that worked at a job or business in the past 12 months has been stable since 2003 but remains lower than the rate for the general population (82.5%). This suggests that mental illness limits employment potential and/or that there are fewer opportunities for workforce participation for people experiencing mental health problems. Hence, this indicator is coded red. Limitations:People with a common mental health condition are defined as those who report having received a diagnosis of an anxiety disorder and/or mood disorder by a health care professional. Rates of employment for people with serious mental illnesses, such as schizophrenia, are known to be very low. Employment rates here are higher than they would be if other serious mental illness could be included.
|
||||
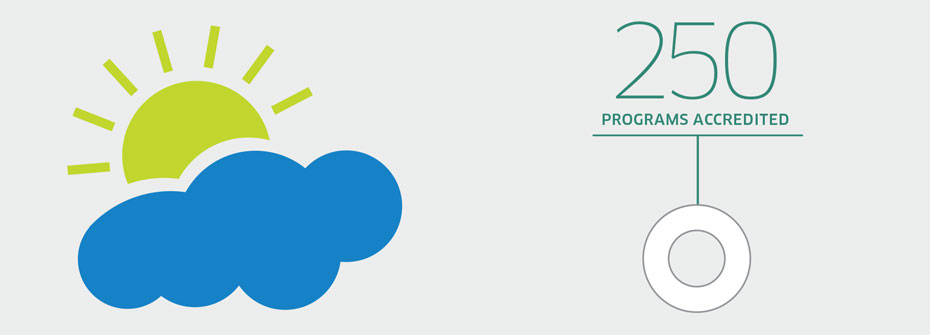
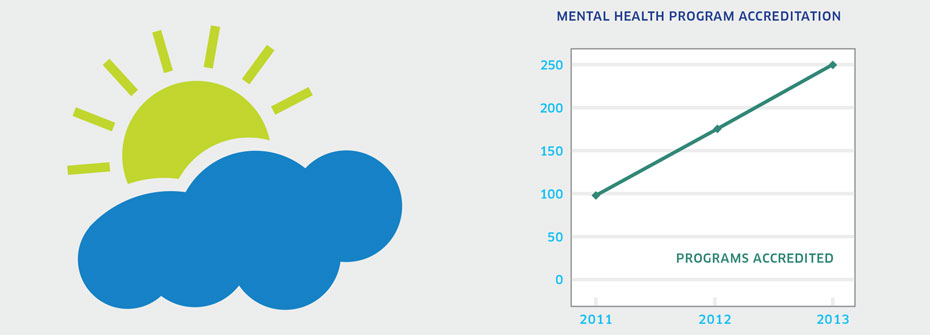
| RECOVERY-FOCUSED PROGRAM ACCREDITATION | Recovery and Rights | 250 PROGRAMS | ||
|
✕
Recovery
RECOVERY-FOCUSED PROGRAM ACCREDITATION
   About
What it tells us
Links to MHCC Activities
What it is:The number of Canadian programs meeting the accreditation standards for mental health programs developed by Accreditation Canada as of 2013. Source:Special data request to Accreditation Canada. Why it's important:Accreditation Canada has developed accreditation standards for mental health programs in both the hospital and, since 2011, community-based settings. The most recent standards put greater emphasis on the recovery aspects of mental health care. An increase in mental health program accreditation would suggest increasing availability of recovery-based services for people with mental disorders. What it tells usData available from Accreditation Canada shows 250 programs have been accredited over the years 2011, 2012, 2013. Thirty-six programs were in the mental health sector. In terms of the number of programs accredited per year, there has been little change which is not consistent with increasing availability of recovery-based programs. Hence this indictor is coded yellow. Limitations:Accreditation of mental health services is in its early stages. Within Canada, there is no overall count of the total number of mental health programs in the country. This precludes a determination of the percentage of programs accredited. Accreditation Canada is not the only accrediting body for mental health programs in Canada.
|
||||
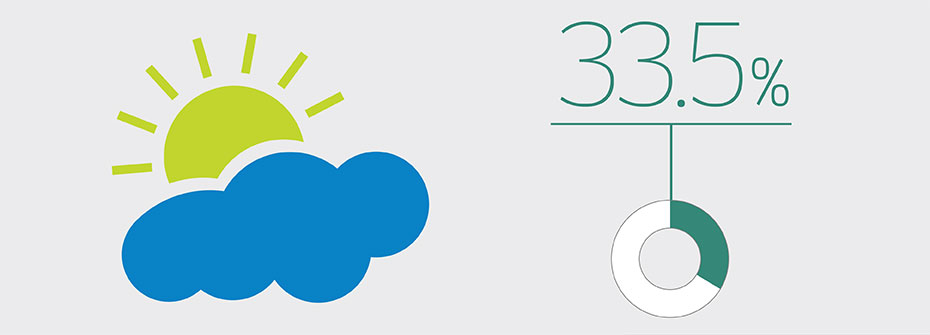
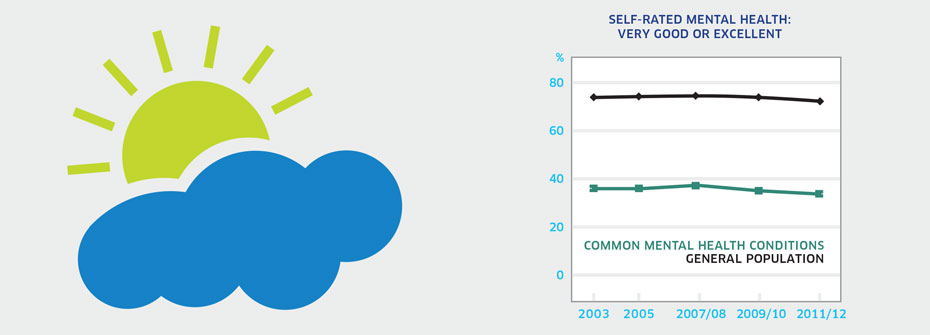
| SELF-RATED MENTAL HEALTH IN PEOPLE WITH COMMON MENTAL HEALTH CONDITIONS | Recovery and Rights | 33.5 | ||
|
✕
Recovery
SELF-RATED MENTAL HEALTH IN PEOPLE WITH COMMON MENTAL HEALTH CONDITIONS
   About
What it tells us
Links to MHCC Activities
What it is:The percentage of Canadians aged 15 to 75 years that worked over the past year and reported that most days at work are quite a bit stressful or extremely stressful in 2011/2012. Source:Canadian Community Health Survey, Public Use Microdata File, Statistics Canada (years 2003, 2005, 2007/08, 2009/10, 2011/12). Why it's important:Mental health is not equivalent to the absence of mental illness. However, the presence of mental illness may have an impact on mental health. Self-rated mental health reflects a person’s capacity for enjoyment, sense of wellbeing, and coping abilities despite existing challenges and limitations. The goal of recovery efforts is to foster circumstances that promote good mental health, particularly among those with chronic mental health conditions. What it tells usOnly one-third of Canadians with common mental health conditions report very good or excellent mental health. While this proportion is not different from previous years, it is dramatically lower than the 72% of Canadians that report very good or excellent mental health. Therefore this indicator is coded red. Limitations:Common mental health conditions in this context include mood and anxiety disorders only and are not representative of the full spectrum of mental disorders.
|
||||
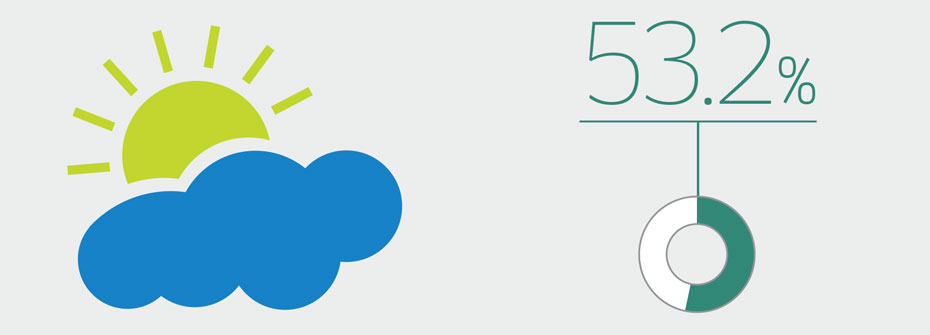
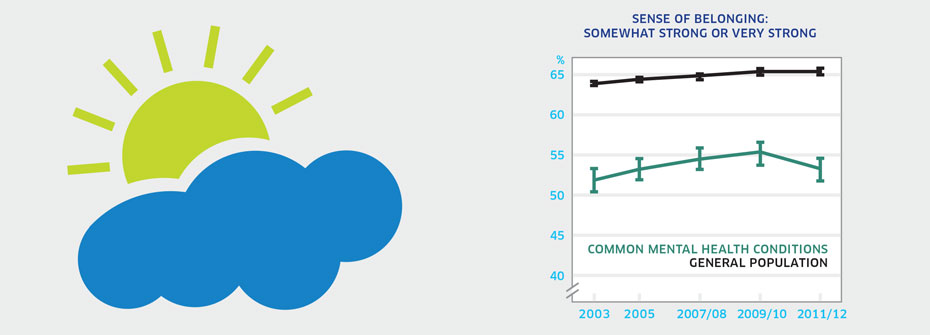
| SENSE OF BELONGING - PEOPLE WITH COMMON MENTAL HEALTH CONDITIONS | Recovery and Rights | 53.2 | ||
|
✕
Recovery
SENSE OF BELONGING - PEOPLE WITH COMMON MENTAL HEALTH CONDITIONS
   About
What it tells us
Links to MHCC Activities
What it is:The percentage of Canadians aged 12 or older with common mental health conditions that described their sense of belonging to their local community as somewhat strong or very strong in 2011/2012. Source:Canadian Community Health Survey, Public Use Microdata File, Statistics Canada (years 2003, 2005, 2007/08, 2009/10, 2011/12). Why it's important:Recovery from mental health problems is improved through social networks and community connections. The extent to which people with common mental health conditions report a strong sense of belonging to their local communities reflects one component of support for recovery. What it tells usJust over one-half of Canadians with a common mental health condition report that their sense of community belonging is strong. This rate has not changed since first measured in 2003 and is lower than reported sense of belonging in the general population (65.4%). Hence, this indicator is coded red. Limitations:Common mental health conditions in this context include mood and anxiety disorders only and are not representative of the full spectrum of mental disorders. The term local community may be interpreted in many ways. Individuals may feel a strong sense of belonging with a subgroup or subculture yet may not feel a sense of belonging to the broader community in which they live.
|
||||
 Seniors |
||||
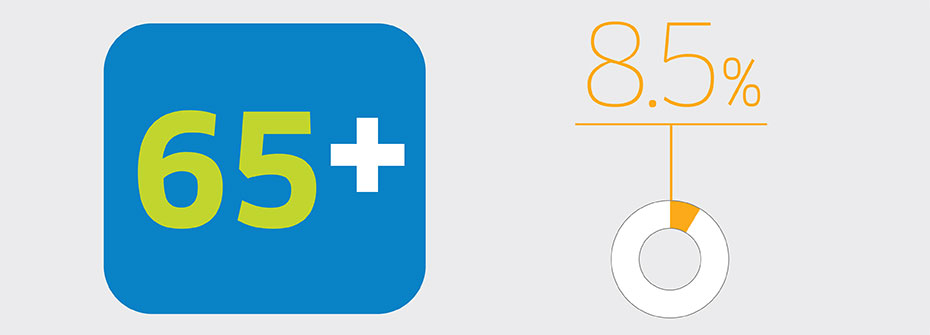
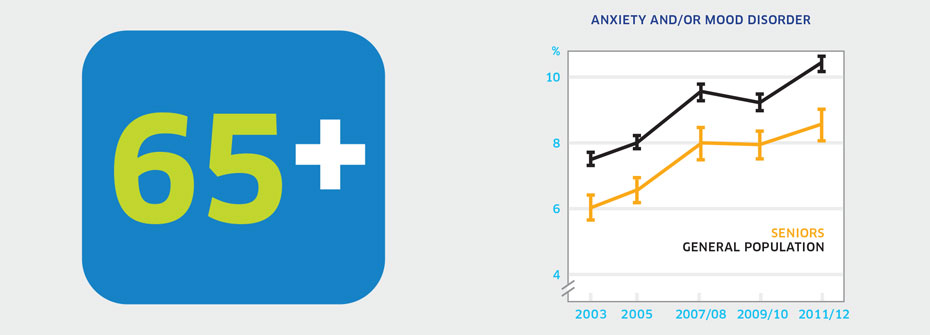
| Anxiety And/or Mood Disorders - Seniors | Promotion and Prevention | 8.5 | ||
|
✕
Seniors
Anxiety And/or Mood Disorders - Seniors
   About
What it tells us
Links to MHCC Activities
What it is:The percentage of Canadians aged 65 years or older that reported in 2011/2012 that they have an anxiety disorder and/or mood disorder which has been diagnosed by a health care professional. Source:Canadian Community Health Survey, Statistics Canada, Public Use Microdata File, Statistics Canada (years 2003, 2005, 2007/08, 2009/10, 2011/12). Why it's important:Anxiety and mood disorders are the most common mental health conditions experienced over the lifespan. These conditions do not necessarily decline with age. Seniors may be less likely to report psychiatric concerns to their family doctor and symptoms may be misconstrued as early dementia or other age-related changes. As a result, seniors with common mental health conditions may not receive the appropriate treatment. What it tells usOnly 8.5% of seniors report having ever been diagnosed with an anxiety disorder and/or mood disorder. While this rate may be considered low, it is significantly higher than reported rates in 2003 (6.0%) and 2005 (6.5%). Whether increases reflect a real change in the prevalence of anxiety disorders and/or mood disorders or of an improvement in the detection and diagnosis of these conditions by health care professionals is not known. Consequently, this indicator is coded yellow. Limitations:Self-reports of diagnosed anxiety and mood disorders are based on single survey questions and may not correspond to prevalence rates based on epidemiologic studies. Reported receipt of a diagnosis for an anxiety and/or mood disorder does not necessarily imply receipt of treatment.
|
||||
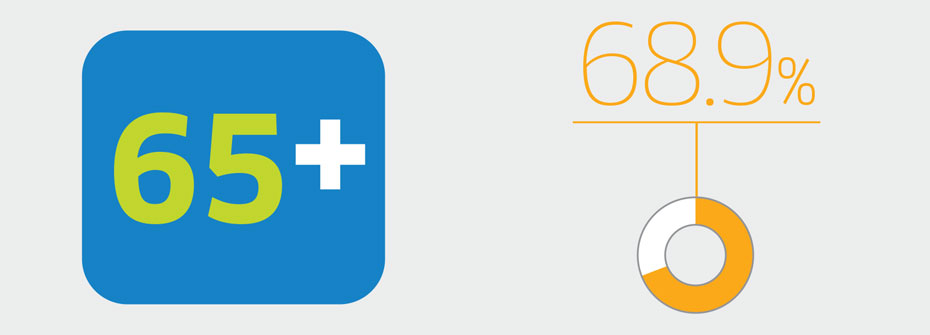
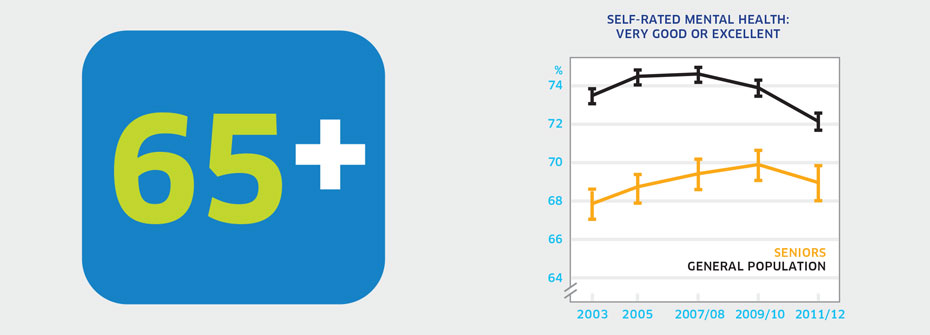
| SELF-RATED MENTAL HEALTH - SENIORS | Promotion and Prevention | 68.9 | ||
|
✕
Seniors
SELF-RATED MENTAL HEALTH - SENIORS
   About
What it tells us
Links to MHCC Activities
What it is:The percentage of Canadians aged 65 years or older that reported their mental health as very good or excellent in 2011/2012. Source:Canadian Community Health Survey, Public Use Microdata File, Statistics Canada (years 2003, 2005, 2007/08, 2009/10, 2011/12). Also available from CANSIM table 105-1101. Why it's important:Seniors are considered more vulnerable to poor mental health given an increasing likelihood of health concerns, possible physical activity limitations, and fewer opportunities for social interaction. What it tells usApproximately 69% of seniors report their own mental health as very good or excellent. Overall, this figure has been relatively stable since 2003. However, it remains lower than the percentages of youth and adults who rate their mental health as very good or excellent. Consequently, this indicator is coded red. Limitations:Not all seniors enjoy good mental health. When taken as a measure of the entire population of seniors, lower or higher rates of mental health among distinct groups can be masked. High self-rated mental health does not necessarily mean an absence of mental illness.
|
||||
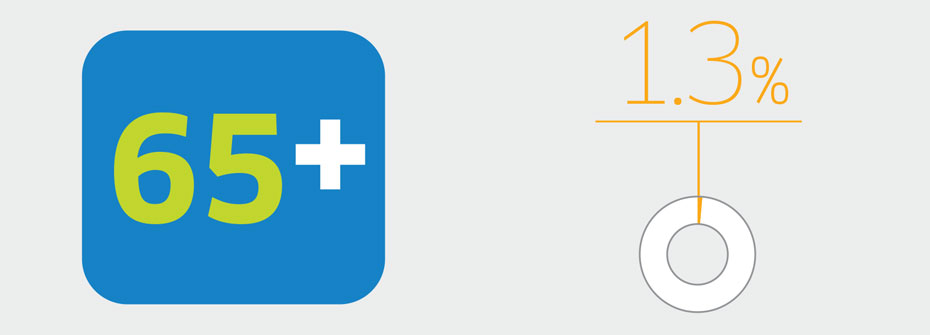
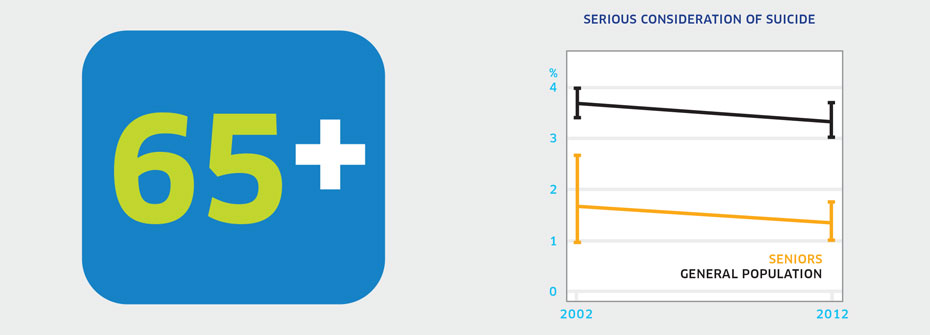
| SERIOUS CONSIDERATION OF SUICIDE - SENIORS | Promotion and Prevention | 1.3 | ||
|
✕
Seniors
SERIOUS CONSIDERATION OF SUICIDE - SENIORS
   About
What it tells us
Links to MHCC Activities
What it is:The percentage of Canadians aged 65 or older that reported, in 2012, having seriously thought about suicide or taking their own life in the last 12 months. Source:Canadian Community Health Survey, Mental Health Supplement, Public Use Microdata File, Statistics Canada (years 2002 and 2012). Why it's important:Deteriorating health, functioning, and independence along with a reduction in social contacts may place older adults at higher risk for depression and thoughts of suicide. What it tells usA very small percentage (1.3%) of seniors report having serious consideration of suicide over the last 12 months. This rate is lower than in other age groups and has not changed over the last decade. Consequently, this indicator is coded green. Limitations:In 2002, data collection issues meant that some results had to be imputed. Seniors often do not report health problems and therefore the rate of serious consideration of suicide may be underreported.
|
||||
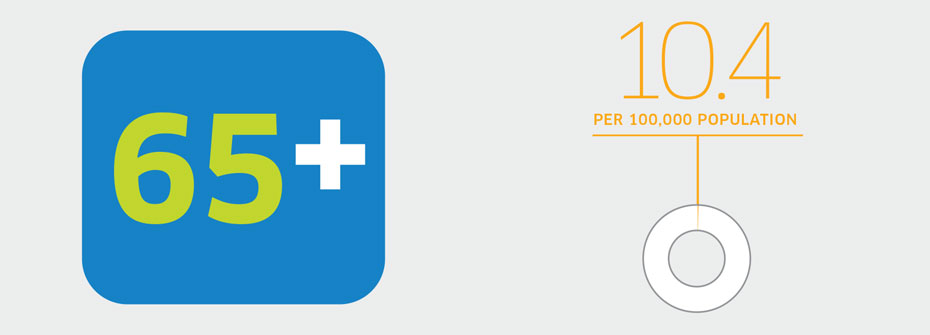
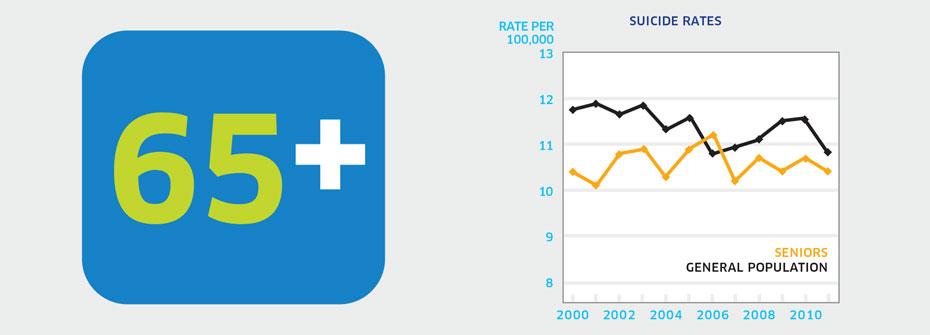
| SUICIDE RATES - SENIORS | Promotion and Prevention | 10.4 PER 100,000 | ||
|
✕
Seniors
SUICIDE RATES - SENIORS
   About
What it tells us
Links to MHCC Activities
What it is:The rate of suicide per 100,000 Canadians aged 65 years or older in 2011. Source:Statistics Canada CANSIM Table 102-0551. Why it's important:Several factors may contribute to an increased risk of depression and suicide with aging. These include potential deterioration in health, loss of independence, income reduction, and social isolation. What it tells usThe rate of suicide in seniors (10.4 per 100,000) has been very stable over the past decade. Rates are considerably higher among males than females with men over 85 having the highest suicide rate (29 per 100,000). Given a failure to reduce the seniors’ suicide rate over time and alarmingly high rates for older men, this indicator is coded red. Limitations:Investigations of cause of death can be difficult and consequently the determination of death by suicide may not always be accurate.
|
||||
 Stigma |
||||
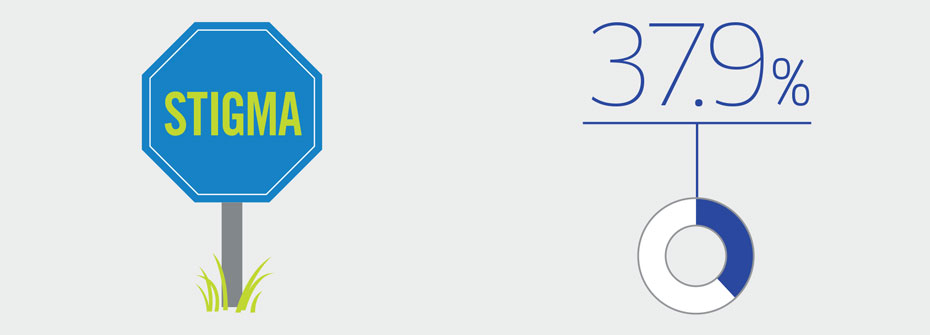
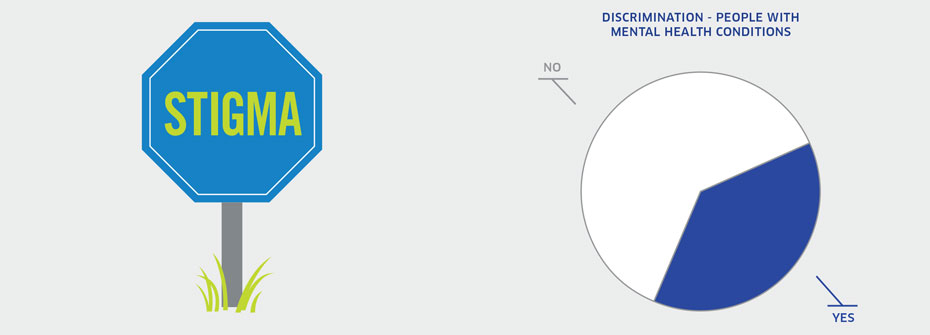
| DISCRIMINATION AMONG PEOPLE WITH MENTAL HEALTH CONDITIONS | Disparities and Diversity | 37.9 | ||
|
✕
Stigma
DISCRIMINATION AMONG PEOPLE WITH MENTAL HEALTH CONDITIONS
   About
What it tells us
Links to MHCC Activities
What it is:The percentage of Canadians with mental health conditions aged 15 years or older that reported, in 2009, having experienced discrimination or been treated unfairly by others over the past five years. Source:General Social Survey, Statistics Canada, Cycle 23 (2009). Why it's important:Stigma surrounding mental illness often results in discrimination that can limit opportunities for people with mental health problems to access services, employment, housing, and community/social support. Discrimination represents a risk factor for poor mental health. What it tells usHigher rates of discrimination are evident among people with mental health conditions than among those without such difficulties. Nearly 40% of people affected by mental health conditions reported some form of discrimination or unfair treatment, while only 14.2% of those without mental health problems reported this experience. Therefore, this indicator has been coded red. Limitations:The General Social Survey does not include a question about discrimination or unfair treatment experienced because of one’s mental health. Discrimination questions are asked in relation to a number of other identifiable and non-identifiable personal characteristics.
|
||||
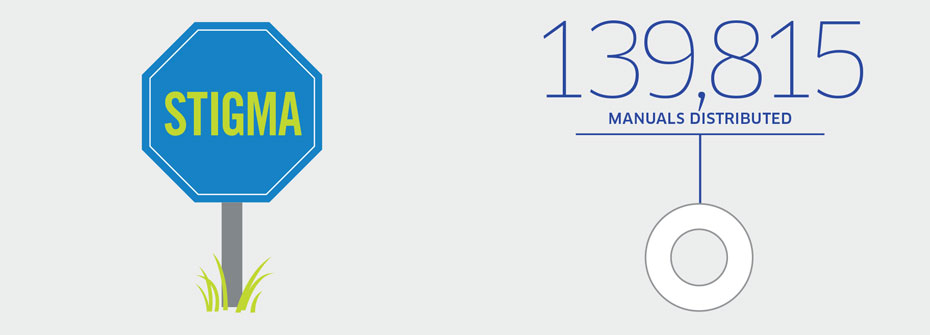
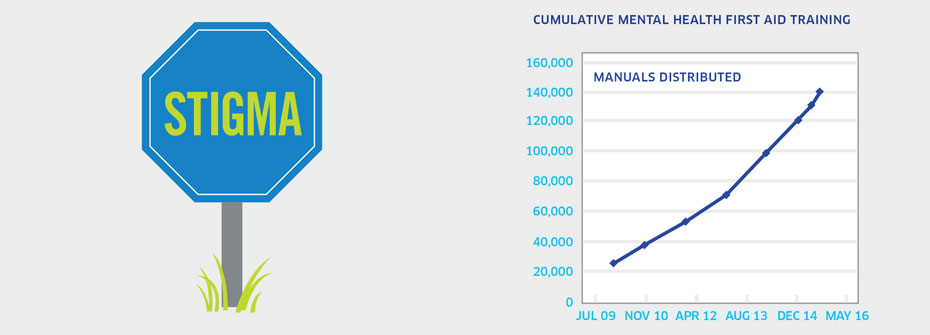
| MENTAL HEALTH FIRST AID TRAINING | Promotion and Prevention | 139,815 MANUALS | ||
|
✕
Stigma
MENTAL HEALTH FIRST AID TRAINING
   About
What it tells us
Links to MHCC Activities
What it is:The total number of Mental Health First Aid (MHFA) manuals distributed as of March 31, 2015 as an indicator of the number of individuals participating in training. Source:Mental Health First Aid Initiative, Mental Health Commission of Canada, (January 2007 – March 31, 2015). Why it's important:The MHFA Canada program aims to address stigma through improving mental health literacy and equipping people with knowledge and skills to address and respond to mental health problems experienced by themselves, a family member, friend, or a colleague. MHFA participants receive a training manual while attending the training. Thus the number of manuals distributed provides an indication of the number of people who have attended MHFA training. What it tells usThe number of manuals distributed suggests that there has been increasing participation in MHFA training over time. Therefore, this indicator is coded green. Limitations:The use of the number of manuals to represent the number of individuals participating in MHFA training may overestimate the number of participants. However, as manuals are a direct cost to the instructor (or instructor’s institution), the likelihood of large surpluses of manuals is considered to be low.
|
||||
| UNMET NEED FOR GENERAL HEALTH CARE AMONG PEOPLE WITH COMMON MENTAL HEALTH CONDITIONS | Access to Services | 24.2 | ||
|
✕
Stigma
UNMET NEED FOR GENERAL HEALTH CARE AMONG PEOPLE WITH COMMON MENTAL HEALTH CONDITIONS
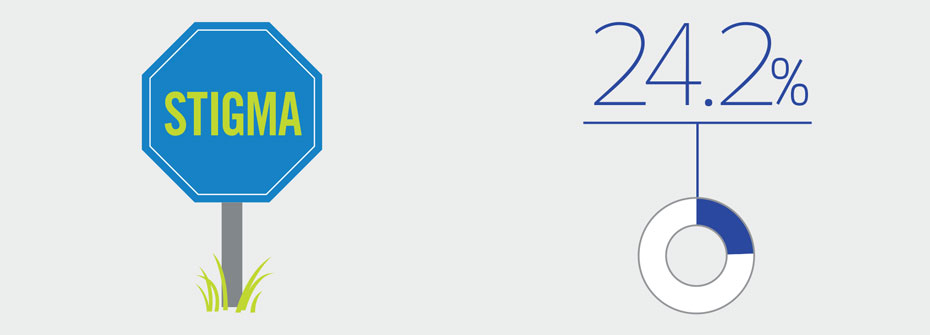 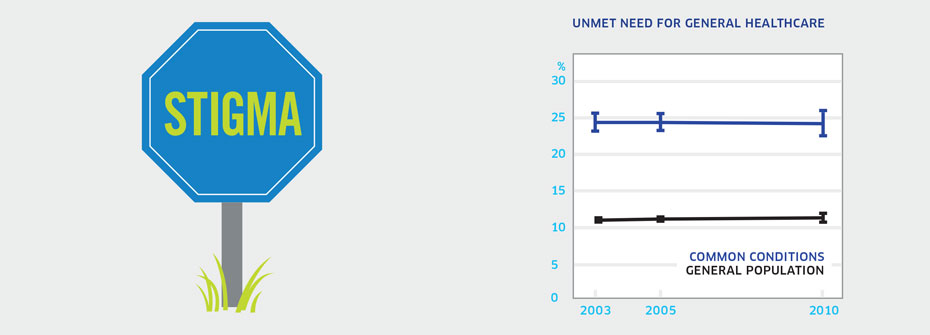  About
What it tells us
Links to MHCC Activities
What it is:The percentage of Canadians aged 12 years or older with a common mental health condition that report not receiving general health care in 2010. Source:Canadian Community Health Survey, Public Use Microdata File, Statistics Canada (years 2003, 2005, 2010). Why it's important:Individuals with mental health problems have higher rates of mortality and morbidity. Yet access to general medical care is known to be lower in this group. Efforts to improve access of people with mental disorders to general health care should help diminish elevated rates of morbidity and mortality in this population. What it tells usNearly one-quarter of those with common mental health conditions report that there was a time in the last year when they perceived a need for health care but did not receive it. This is over twice the rate of the general population (11.4%). The percentage has not changed since 2003. For these reasons the indicator is coded red. Limitations:Self-reports of diagnosed anxiety and mood disorders are based on single survey questions and may not correspond to prevalence rates based on epidemiologic studies.
|
||||
| WILLINGNESS TO SEEK HELP FROM A MENTAL HEALTH PROFESSIONAL - COLLEGE & UNIVERSITY STUDENTS | Promotion and Prevention | 74.0 | ||
|
✕
Stigma
WILLINGNESS TO SEEK HELP FROM A MENTAL HEALTH PROFESSIONAL - COLLEGE & UNIVERSITY STUDENTS
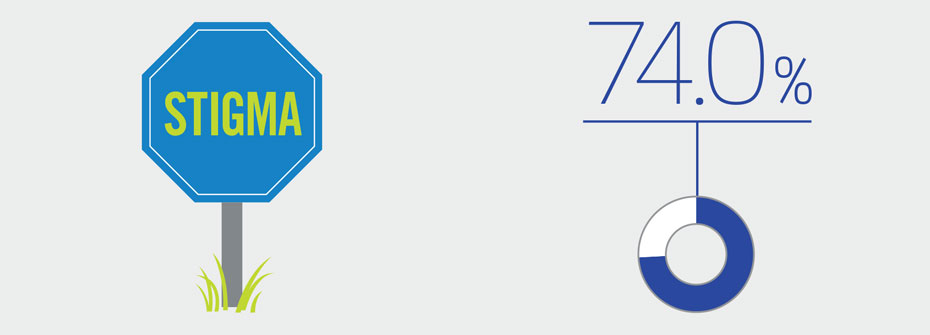 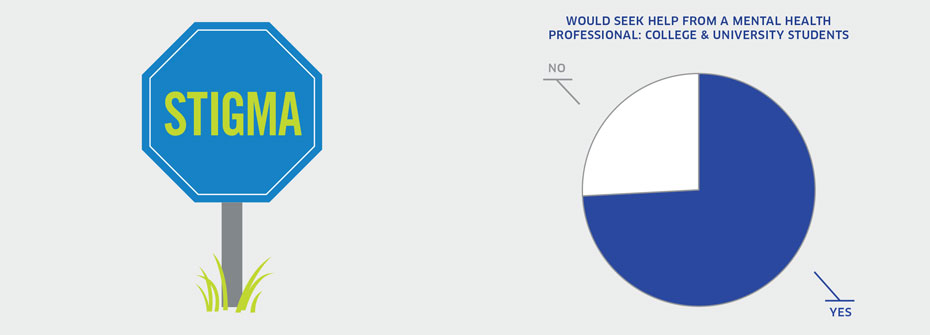  About
What it tells us
Links to MHCC Activities
What it is:The percentage of college and university students that indicated they would consider seeking help in the future from a mental health professional for a personal problem in 2013. Source:American College Health Association, National College Health Assessment. Canadian Reference Group Data Report (Spring 2013). Why it's important:Access to mental health services for young adults is important to minimize the impact of problems on lifelong functioning. Negative attitudes and misinformation are aspects of stigma which can prevent people from seeking help. A willingness to seek help increases the likelihood of early intervention and better outcomes. What it tells usThe majority of students attending colleges and universities in Canada report they would pursue help from a mental health professional for a personal problem. Consequently, the indicator is coded green. Limitations:The National College Health Assessment survey included a sample of approximately 34,000 students in 32 post-secondary institutions. The mean response rate of 20% among students suggests that results may not represent the larger post-secondary population with complete accuracy.
|
||||
 Suicide |
||||
| SERIOUS CONSIDERATION OF SUICIDE – GENERAL POPULATION | Promotion and Prevention | 3.3 | ||
|
✕
Suicide
SERIOUS CONSIDERATION OF SUICIDE – GENERAL POPULATION
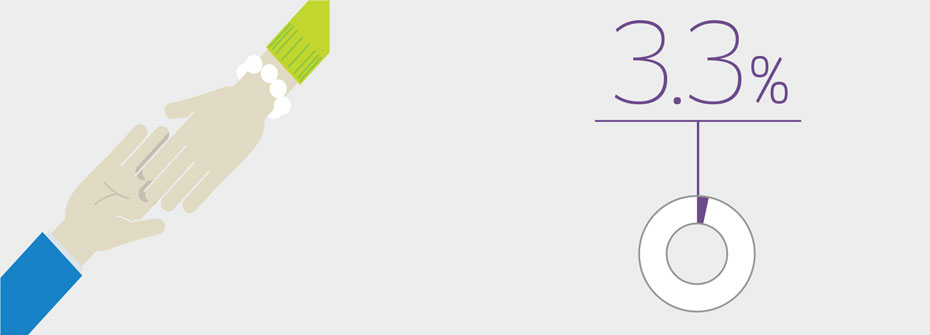 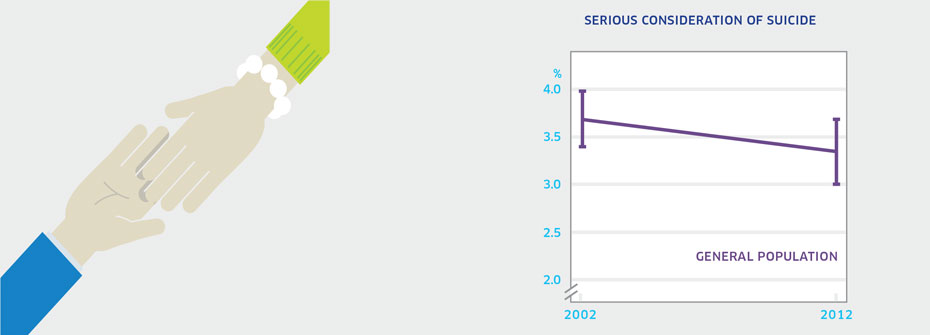  About
What it tells us
Links to MHCC Activities
What it is:The percentage of Canadians aged 15 years or older that reported, in 2012, having seriously thought about suicide or taking their own life in the last 12 months. Source:Statistics Canada CANSIM Table 105-1101. Data also available from Canadian Community Health Survey, Mental Health Supplement, Public Use Microdata File, Statistics Canada (years 2002 and 2012). Why it's important:Most people who express suicidal thoughts will not die by suicide. However serious consideration of suicide may be associated with severe depression and hopelessness and signals a need for professional help. As such, serious thoughts of suicide are an important risk factor. What it tells usReports of serious consideration of suicide in 2012 (3.4%) have remained largely stable since 2002 (3.7%). Due to the lack of change over the 10-year period, this indicator is coded yellow. Limitations:When taken as a measure of the entire population, rates of serious consideration of suicide among distinct groups can be masked. In 2002, data collection issues meant that some results had to be imputed.
|
||||
| Suicide Rates - General Population | Promotion and Prevention | 10.8 PER 100,000 | ||
|
✕
Suicide
Suicide Rates - General Population
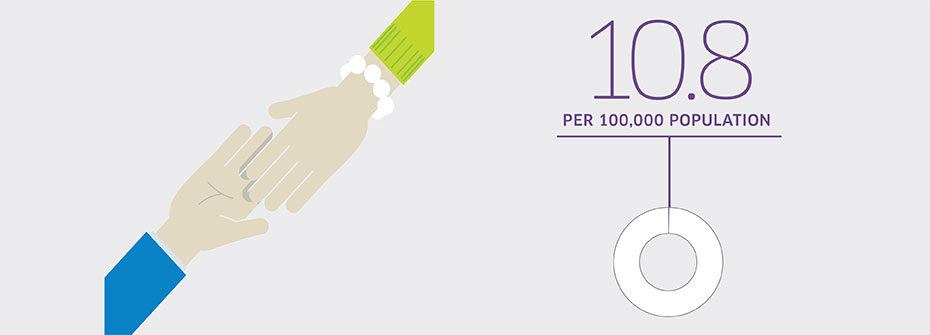 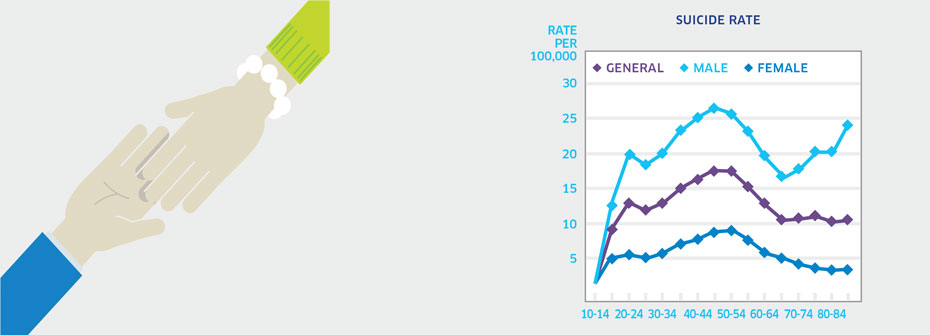  About
What it tells us
Links to MHCC Activities
What it is:The rate of suicide per 100,000 Canadians in 2011. Source:Statistics Canada CANSIM Table 102-0551. Why it's important:Suicide is inarguably the most tragic consequence of mental illness. Among those who die by suicide, a very large percentage has a history of mental health problems. Suicide is preventable and a better understanding of the numbers, characteristics, and contexts can help us better learn how and when to intervene. What it tells usA rate of 10.8 per 100,000 represents 3,728 Canadian deaths due to suicide in 2011. Suicide rates are higher among males than females. In 2011 the rate for males was 16.3 per 100,000 while that for females was 5.4 per 100,000. Overall, rates peak between the ages of 40 and 60 and a trend is evident for increased suicide in later life for men. Rates of suicide in Canada have not changed over the last ten years, and remain higher than the rates in some G8 countries. This, coupled with the high rate of suicide among Canadian males relative to females, is cause for concern. Hence this indicator is coded red. Limitations:Investigations of cause of death can be difficult and consequently the determination of death by suicide may not always be accurate.
|
||||
| * As outlined in the MHCC’s Mental Health Strategy for Canada | ||||